The Asset‑Price State: How the U.S. Fiscal Machine Now Depends on Rising Markets

What this post argues
The U.S. does not merely like a high stock market. It increasingly needs one.
The stock market has become an amplifier inside the largest federal revenue pipe: individual income tax. When asset prices rise, capital gains, stock compensation, options, bonuses, business equity, and other asset-sensitive income strengthen federal receipts. When the market falls hard, that same amplifier runs in reverse.
This matters because the real debt problem is not debt alone. It is interest cost relative to federal revenue. If interest grows faster than normal revenue, the system becomes more dependent on asset inflation, AI valuations, national champions, and foreign capital to keep the fiscal machine stable.
That is the Asset-Price State: a system where private asset prices perform public fiscal work.
1. The three findings
This is not a new discovery in the sense that the data is hidden. The plumbing of the U.S. fiscal system is public record. The CBO publishes the revenue flows. The Federal Reserve publishes the wealth distribution. The Treasury publishes the debt. The market prices are visible every day.
What is new is the analysis of the system as a whole.
When you connect the loops, three structural realities become impossible to ignore.
-
The stock market is now a driver, not just a scoreboard. Not because every household owns stocks equally. They do not. The stock market is brutally concentrated. But structurally, the market now supports retirement wealth, collateral, corporate financing, consumer confidence, high-end spending, AI capex, national champions, and the political scoreboard of economic success. 1[6]
-
The stock market is a federal revenue engine. More than half of U.S. federal revenue comes from individual income taxes. That revenue pipe is heavily concentrated at the top, and the top of the income distribution is where stock ownership, capital gains, RSUs, options, bonuses, business equity, and taxable investment income are concentrated. 13
-
The stock market must grow to keep the debt system stable. If interest costs rise faster than ordinary revenue, the missing revenue has to come from somewhere. The politically easy sources are limited. The system can cut spending, raise taxes, default, inflate, or grow the asset base. The path it already knows how to use is asset inflation. 4
    flowchart LR
    A["📊 <b>1. Revenue Source</b><br/>CBO: Individual income taxes are<br/>the largest federal revenue pipe"] -->
    B["🏦 <b>2. Tax Concentration</b><br/>CBO: A large share of federal taxes<br/>comes from top earners"]

    B -->
    C["📈 <b>3. Asset Concentration</b><br/>Fed/FRED: The top owns most stocks"]

    C -->
    D["🎢 <b>4. Volatility Mechanism</b><br/>CBO: Capital gains move with asset prices<br/>and are highly cyclical"]

    D -->
    E["⚠️ <b>5. Hidden System</b><br/>Federal revenue is amplified<br/>by stock-market performance"]

    E -->
    F["🔥 <b>Implication</b><br/>A prolonged market fall becomes<br/>a fiscal problem, not just a market problem"]

    classDef step1 fill:#dbeafe,stroke:#1d4ed8,stroke-width:2px,color:#111827,font-weight:bold;
    classDef step2 fill:#dcfce7,stroke:#15803d,stroke-width:2px,color:#111827,font-weight:bold;
    classDef warn fill:#ffedd5,stroke:#ea580c,stroke-width:3px,color:#7c2d12,font-weight:bold;
    classDef final fill:#fee2e2,stroke:#dc2626,stroke-width:3px,color:#7f1d1d,font-weight:bold;

    class A,B step1;
    class C,D step2;
    class E warn;
    class F final;

    linkStyle 0 stroke:#1d4ed8,stroke-width:2px;
    linkStyle 1 stroke:#15803d,stroke-width:2px;
    linkStyle 2 stroke:#15803d,stroke-width:2px;
    linkStyle 3 stroke:#ea580c,stroke-width:3px;
    linkStyle 4 stroke:#dc2626,stroke-width:3px;
1.1 The revenue pipe
The Treasury’s own revenue data makes the first part of the argument impossible to ignore.
The largest source of U.S. federal revenue is not corporate tax. It is not tariffs. It is not customs duties. It is not some obscure financial levy.
It is individual income tax.
So far in FY2026, individual income taxes account for roughly 52% of total federal revenue. Social Security and Medicare taxes account for another 34%. Everything else is smaller.
That means the U.S. fiscal machine depends first and foremost on taxing individual income.
But “individual income” is not just wages.
At the top of the distribution, individual income includes capital gains, stock options, RSUs, bonuses, business equity, taxable investment income, and other asset-linked flows.
This is where the stock market enters the system.
The stock market does not literally appear as a single line item called “stock market revenue” in the Treasury tables. That would be too simple.
Instead, it hides inside the largest pipe.
When asset prices rise, high-income taxable income rises disproportionately. Capital gains are realised. Stock compensation becomes more valuable. Options are exercised. RSUs vest. Bonuses expand. Business valuations rise. High-end consumption holds up.
Some of that private asset inflation becomes public revenue.
That is the Asset-Tax Amplifier.
The stock market is not the largest federal revenue category directly.
It is more important than that.
It is the amplifier inside the largest federal revenue category.
1.2 The spending curve does not flatten
Before we model the stock market, we need to model the spending side.
Because one of the quiet assumptions in normal political debate is that the government can somehow hold spending steady.
That assumption is fantasy.
The U.S. federal budget is not a normal household budget. It is a machine with built-in escalators: Social Security, Medicare, health care costs, defence commitments, debt interest, industrial policy, crisis response, and the political cost of cutting anything people have already come to expect.
The spending curve does not flatten by itself.
CBO’s baseline already shows the problem. Federal outlays are projected to rise from roughly $7.4 trillion in 2026 to $11.4 trillion by 2036. Revenues also rise, but not enough. The deficit still grows from roughly $1.9 trillion to $3.1 trillion over the same period. [S1]
That is under baseline assumptions.
Not crisis assumptions.
Not recession assumptions.
Not war assumptions.
Not banking-system-rescue assumptions.
Just baseline.
This is why the idea that the U.S. can simply “grow out of it” without changing the revenue engine is weak. Spending is already programmed upward. Interest costs are already rising. Mandatory spending is already politically difficult to cut. The system does not need one bad year to become unstable. It only needs the existing curves to keep doing what they are already doing.
That is the fiscal background to the stock-market argument.
The stock market is not just currently important to federal revenue. It needs to become more important.
This is the key point.
If spending keeps rising, and interest keeps rising, and ordinary revenue growth is not enough, then the missing revenue has to come from somewhere.
Payroll taxes cannot double without crushing labour.
Corporate taxes are too small a pipe.
Tariffs are unstable and inflationary.
Spending cuts are politically brutal.
Explicit tax hikes are politically dangerous.
That leaves the easiest politically scalable mechanism the system already knows how to use:
asset inflation.
Push asset prices higher. Let the top of the income distribution realise gains. Let RSUs vest at higher values. Let options become valuable. Let bonuses expand. Let business valuations rise. Let high-end consumption continue. Let capital gains and asset-linked income flow into the individual income-tax system.
The stock market does not simply need to stay high.
It needs to grow into the gap.
That is why the next stage of the model is not just:
“How high are stocks?”
It is:
“How high do stocks need to go for the revenue system to keep pace with the spending and interest curve?”
    graph LR
    A["💸 Spending is not flat"] --> B["📈 Interest is the fastest-growing pressure"]
    B --> C["💵 Revenue is concentrated in individual income taxes"]
    C --> D["👑 Income taxes are concentrated at the top"]
    D --> E["💹 The top is asset-price-sensitive"]
    E --> F["🏛️ Therefore the stock market must carry more of the system over time"]

    style A fill:#f9d,stroke:#333,stroke-width:2px,color:#000
    style B fill:#bbf,stroke:#333,stroke-width:2px,color:#000
    style C fill:#bfb,stroke:#333,stroke-width:2px,color:#000
    style D fill:#ffd,stroke:#333,stroke-width:2px,color:#000
    style E fill:#fdd,stroke:#333,stroke-width:2px,color:#000
    style F fill:#ddf,stroke:#333,stroke-width:2px,color:#000
1.3 Interest versus revenue: the rollover problem
The next part of the model is interest.
This is where the system becomes dangerous.
At first glance, the U.S. debt burden looks manageable because the current average interest rate on the debt is still relatively low. The blended cost is around the low-three-percent range.
But that number is backward-looking.
It reflects the average cost of debt issued across many previous years, including years when rates were close to zero. It is not the true cost of issuing or rolling debt in the current market.
That distinction matters.
The U.S. is not refinancing a small loan. It is constantly rolling an enormous stock of debt. As old debt matures, it has to be refinanced at current market rates. If current rates are higher than the blended rate, the interest burden rises even if nothing else changes.
This is the rollover problem.
The U.S. is still paying yesterday’s blended debt cost, but it must refinance into today’s rate environment.
That is why this section models interest rates from 4% to 12%.
Not because 12% is the base case.
It is not.
But because the system needs to be stress-tested.
A debt system that looks survivable at 3.3% can become structurally different at 5%. At 7.5%, it starts consuming the budget. At 10% or 12%, it becomes a political and monetary emergency.
The important question is not simply:
“How much debt does the U.S. have?”
The better question is:
“At what interest rate does the debt stock begin to overwhelm the revenue system?”
That is what we model next.
1.4 The rollover stress model
We model the debt burden in two ways.
First, we model the debt stock growing normally over time.
Debt(t) = Debt(0) × (1 + debt_growth_rate)^t
This gives us the normal debt curve.
Then we apply different effective interest rates to that debt stock.
Interest(t) = Debt(t) × effective_interest_rate
The interest-rate scenarios are:
4%
5%
7.5%
10%
12%
This is not a precise Treasury maturity model. A full model would use the maturity schedule, bill/note/bond composition, auction calendar, inflation assumptions, and CBO rate path.
But that is not the purpose here.
The purpose is to expose the scale of the pressure.
If the debt stock is roughly stable, a higher interest rate increases the interest bill directly. If the debt stock keeps growing, the interest burden compounds.
That gives us the first curve:
normal debt growth
→ effective rollover rate
→ annual interest burden
The second curve is revenue.
Revenue(t) = Revenue(0) × (1 + normal_revenue_growth_rate)^t
Now we can compare the two.
If revenue grows at 4% but interest grows at 7%, 10%, or 12%, the gap widens quickly.
That gap is the problem.
The government has to close it somehow.
2. The inflation signal
The official Federal Reserve target is still 2%.
But the more important question is no longer simply:
Is inflation above target?
Yes.
Headline CPI peaked at 8.58% in 2022 Q2, then fell through 2023–2025, but re-accelerated to 3.87% in 2026 Q2. Core CPI peaked at 6.33% in 2022 Q1 and still sits at 2.68% in 2026 Q2 — above the Fed’s 2% target.
The important point is not just that inflation surged in 2021–2022.
It is that inflation has not cleanly returned to target after years of tightening.
So the better question is:
What does the Fed do when inflation remains above target, but raising rates aggressively would damage the debt system, the stock market, the housing market, and the federal revenue machine?
That is the corridor we are entering.
If the Fed raises rates hard enough to crush inflation, it also raises the effective cost of refinancing U.S. debt. The government is still paying a blended debt cost inherited from earlier, lower-rate years. But as debt rolls over, today’s rates become tomorrow’s interest bill.
That is the trap.
The Fed cannot ignore inflation.
But it also cannot treat inflation as the only variable in the system.
Inflation is now entangled with:
debt service
Treasury refinancing
stock-market valuations
housing affordability
bank balance sheets
AI capex
federal tax receipts
dollar credibility
This is why the measurement layer matters.
If policymakers begin emphasizing alternative inflation measures, temporary effects, trimmed-mean inflation, or broader “underlying” gauges, that does not automatically mean the 2% target has been abandoned.
But it does show how constrained systems behave.
When a system cannot solve a problem directly, it starts changing which signal it treats as decisive.
That is not conspiracy.
It is systems behaviour.
A central bank facing above-target inflation, rising debt-service pressure, fragile asset prices, and political demand for lower rates has an incentive to distinguish between two kinds of inflation.
Bad inflation de-anchors expectations and forces rate hikes.
Tolerable inflation lifts nominal GDP, raises nominal tax receipts, supports asset prices, and reduces the real burden of old debt.
That distinction is where the fiscal system enters monetary policy.
The stock market needs liquidity.
The Treasury needs manageable rates.
The government needs revenue.
The debt stock benefits from inflation.
The public needs prices to stop rising.
Those goals cannot all be maximized at the same time.
So policy becomes an exercise in choosing which pain can be delayed, renamed, or distributed.
That is why inflation belongs near the top of this post.
The Asset-Price State does not work without it.
The system needs inflation high enough to lift nominal revenue and asset prices, but not so high that the bond market revolts or the public loses faith in the currency.
That is the narrow path:
high enough inflation to dilute the debt
low enough inflation to preserve credibility
low enough rates to protect debt service
high enough stocks to support federal revenue
This is the policy corridor.
The Fed may still talk about 2%.
But the system increasingly behaves as if the real target is not simply low inflation.
The real target is controlled inflation plus high asset prices.
That is what keeps the machine alive.
3. Why this is an AI post, not a finance rant
programmer.ie is about AI, systems, software, and modelling.
So this post is not about predicting next month’s S&P 500 move.
It is not a claim that some hidden room in Washington sets stock prices.
It is an attempt to model a complex system whose effects are visible, but whose internal mechanism is easy to miss until the flows are connected.
The stock market rises.
Mega-cap valuations stretch.
AI infrastructure spending explodes.
SpaceX becomes a multi-trillion-dollar object.
Policymakers panic when markets fall.
The dollar remains dominant even as purchasing power weakens.
Foreign companies become cheap relative to U.S. companies.
Those are symptoms.
The system is underneath.
That is where AI becomes useful.
Not because AI can predict the future.
It cannot.
Not because AI knows where the market will trade next quarter.
It does not.
The value of AI here is different.
AI is useful for decomposing a messy system into variables, assumptions, feedback loops, and failure thresholds.
That is what we used it for.
The starting intuition was simple:
The U.S. seems increasingly dependent on a rising stock market.
That is not a model.
It is a suspicion.
AI helped turn that suspicion into a stress-testable chain:
    graph LR
    A["📈 Debt growth"] --> B["💸 Interest burden"]
    B --> C["🏛️ Federal revenue"]
    C --> D["📊 Asset-sensitive tax receipts"]
    D --> E["🚀 Required stock-market growth"]
    E --> F["🌐 Global consequences"]

    style A fill:#ffcccc,stroke:#b30000,stroke-width:2px,color:#000
    style B fill:#ffe0cc,stroke:#cc5500,stroke-width:2px,color:#000
    style C fill:#ffffcc,stroke:#b3b300,stroke-width:2px,color:#000
    style D fill:#ccffcc,stroke:#2d862d,stroke-width:2px,color:#000
    style E fill:#cce5ff,stroke:#004080,stroke-width:2px,color:#000
    style F fill:#e6ccff,stroke:#5900b3,stroke-width:2px,color:#000
Each part of that chain is public.
The debt is public.
The interest cost is public.
The revenue mix is public.
The concentration of stock ownership is public.
The concentration of income-tax payments is public.
The volatility of capital-gains receipts is public.
The missing step is the system connection.
That is the AI part of the post.
The formulas are simple on purpose.
The goal is not to hide the argument inside a black box.
The goal is to make the argument inspectable.
AI was used as a systems-modelling partner:
intuition
→ decomposition
→ variable selection
→ assumption extraction
→ scenario design
→ adversarial critique
→ simple model
→ human audit
The useful questions were not:
What will the stock market do?
The useful questions were:
Where does stock-market wealth enter federal revenue?

What happens if interest costs rise faster than normal revenue?

Which revenue channels are asset-sensitive?

What assumptions would make the model fail?

What happens if the market falls instead of rises?

At what point does required market growth exceed believable earnings growth?
That is a different use of AI.
Not oracle.
Not ghostwriter.
Not market predictor.
Stress harness.
A programmer would recognise the pattern immediately.
You have a system with inputs, outputs, hidden dependencies, feedback loops, and failure thresholds. You do not understand it by staring at one log line. You build a model. You vary the inputs. You watch where the system leaves normal operating range.
That is what this post does.
It takes the U.S. fiscal machine and stress-tests it under different interest-rate environments:
4%
5%
7.5%
10%
12%
Then it compares those interest paths against normal revenue growth.
Then it asks how much extra revenue would be needed to keep the interest burden from overwhelming the system.
Then it asks how much of that revenue could plausibly come from the Asset-Tax Amplifier.
That produces the important curve:
required stock-market growth
Without the model, “the government needs the stock market high” sounds like a political slogan.
With the model, it becomes a structural question:
At what point does the required stock-market growth become larger than believable earnings growth?
That is where the system becomes unstable.
Not when the stock market is high.
Not when valuations look expensive.
Not even when interest costs rise.
The danger point is when the market has to grow faster than the real economy can justify simply to keep the fiscal machine functioning.
That is the moment the market stops behaving like a normal market and starts behaving like a survival mechanism.
This is why the post connects AI, SpaceX, mega-cap technology, inflation, interest rates, federal revenue, and dollar dominance.
They are not separate stories.
They are one system.
And the purpose of AI here is to make that system visible enough to test, challenge, and attack.
The question is simple:
When does it become impossible?
4. Systems thinking: reality is made of loops
People misread economies because they look at events instead of patterns.
An event is easy to see.
The Fed cuts rates.
Stocks rally.
Inflation rises.
Treasury yields move.
SpaceX IPOs.
Gold rises.
Europe weakens.
Each of these looks like a separate story. Each one gets its own headline, its own analyst note, its own explanation.
But the economy is not a list of events.
It is a machine of loops.
A system looks more like this:
    graph LR
    A["📈 Stocks support wealth"] --> B["💰 Wealth supports tax revenue"]
    B --> C["🧾 Tax revenue supports debt service"]
    C --> D["💳 Debt service pressures policy"]
    D --> E["⚖️ Policy supports stocks"]
    E --> A

    style A fill:#ffe0cc,stroke:#ff8c00,stroke-width:2px,color:#000
    style B fill:#e0f7fa,stroke:#00acc1,stroke-width:2px,color:#000
    style C fill:#e8f5e9,stroke:#43a047,stroke-width:2px,color:#000
    style D fill:#fff3e0,stroke:#fb8c00,stroke-width:2px,color:#000
    style E fill:#f3e5f5,stroke:#8e24aa,stroke-width:2px,color:#000
Once you see the loop, the behaviour becomes less surprising.
Governments do not need to sit in a room and consciously design every outcome. They respond to pressure. They protect the parts of the system that have become load-bearing. They choose the option that causes the least immediate breakage. Over time, those choices become a pattern.
That pattern is the system.
This is why market intervention keeps returning under different names. One decade it is quantitative easing. Another decade it is emergency liquidity. Another decade it is bank support, fiscal transfers, special facilities, industrial policy, or national-security investment.
The label changes.
The loop does not.
The state protects the market because the market now protects parts of the state.
That is the point of this post.
If you treat the stock market as an event-driven casino, the behaviour looks absurd. Valuations look insane. Policy looks inconsistent. Politicians look obsessed with a scoreboard that only reflects the wealth of a minority.
But if you treat the stock market as part of the fiscal architecture, the behaviour becomes easier to understand.
The market supports wealth.
Wealth supports tax receipts.
Tax receipts support debt service.
Debt service pressures policy.
Policy supports the market.
The system closes around itself.
Winter is not an event. It is a pattern. If you misunderstand the pattern, reality punishes you.
The same is true here.
The U.S. stock market is no longer just reacting to the economy.
It has become one of the loops through which the American state maintains itself.
5. The previous posts: from interest/revenue to asset inflation
This post is the fourth part of a sequence.
In the first post, I argued that the most useful way to understand U.S. fiscal pressure is not total debt, and not even total interest expense in isolation.
The key metric is:
Interest as a percentage of federal revenue.
Revenue is oxygen.
Interest is the cost of yesterday.
A state can carry a large debt burden if the cost of that debt remains manageable relative to the revenue system that supports it. But once interest grows faster than revenue, fiscal flexibility collapses. At that point the problem is no longer abstract. It becomes a constraint on what the state can do.
That first post used AI to turn a vague question — “Is U.S. debt becoming a problem?” — into a measurable systems question:
When does interest on U.S. debt become a constraint on the system?
The answer was not collapse.
It was constraint.
An increasing share of government resources becomes consumed by past obligations. That reduces flexibility, increases trade-offs, and makes the system more sensitive to shocks.
The second post then asked a different question.
If the debt curve is becoming harder to sustain, how does the system extend the cycle?
One answer is currency devaluation.
Not necessarily a dramatic overnight collapse. Not necessarily a declared policy. More likely a gradual adjustment through inflation, nominal repricing, asset inflation, and real purchasing-power erosion.
That post framed devaluation as a silent reset.
The debt does not disappear.
The burden is shifted.
Nominal GDP rises. Nominal tax receipts rise. The real value of old debt falls. Asset prices adjust upward. Savers and wage earners absorb part of the loss through reduced purchasing power.
But this post adds the missing mechanism.
The U.S. does not need to devalue only through the visible exchange rate.
It can devalue through the asset base.
This is a more advanced form of currency arbitrage.
Instead of simply weakening the dollar in a way everyone can see, the system can inflate U.S. asset prices.
That does several things at once.
It increases the taxable income of the asset-owning class.
It strengthens federal revenue through the individual income-tax system.
It makes U.S. companies vastly richer in market-cap terms.
It gives those companies acquisition power over foreign competitors.
It allows American firms to buy real global assets using inflated equity.
It forces foreign investors to chase U.S. markets or fall behind.
It exports inflationary pressure through the dollar system without requiring a single formal devaluation event.
This is the deeper mechanism.
The reset is not only:
weaken the dollar
→ reduce real debt
→ inflate nominal revenue
It is also:
inflate U.S. asset prices
→ expand asset-linked taxable income
→ strengthen federal revenue
→ increase U.S. corporate purchasing power
→ export valuation pressure globally
→ make foreign assets cheap relative to U.S. equity
That is why the stock market matters.
It is not simply a scoreboard.
It is not simply a bubble.
It is not merely a rich-person wealth effect.
It is becoming part of the fiscal machinery of the state.
The earlier posts showed the pressure:
interest grows faster than revenue
Then they showed the traditional escape valve:
currency devaluation and inflation
This post shows the operational mechanism:
asset inflation as fiscal support
That is the new layer.
The U.S. can preserve the appearance of dollar strength while inflating the dollar value of its own asset base. It can maintain global demand for dollars while allowing the purchasing power of those dollars to decay. It can keep foreign capital inside the U.S. market by making the U.S. market the only game large enough to absorb global savings.
This is why the phrase “currency devaluation” is no longer enough.
The more accurate phrase is:
asset-price devaluation of the currency.
The dollar may not collapse on a foreign-exchange chart.
But if the price of everything important — stocks, houses, AI companies, strategic infrastructure, defence contractors, energy assets — rises faster than wages and foreign market values, then the currency has still been devalued.
It has just been devalued through assets instead of through a single exchange-rate event.
That is what this post models.
We are not asking whether the stock market is high.
We are asking a harder question:
How high does the stock market need to go for the U.S. revenue system to keep pace with the debt and interest curve?
    flowchart LR
    A["🧮 Post 1<br/><b>Interest / Revenue</b><br/>Debt becomes a constraint when interest grows faster than revenue"] -->
    B["📉 Post 2<br/><b>Silent Reset</b><br/>Inflation and currency adjustment extend the debt cycle"]

    B -->
    C["📈 This Post<br/><b>Asset-Price State</b><br/>Stock-market inflation becomes the operational revenue mechanism"]

    C -->
    D["🏛️ Fiscal Effect<br/>Asset-linked income rises<br/>Federal tax receipts strengthen"]

    C -->
    E["🌍 Global Effect<br/>U.S. companies gain purchasing power<br/>Foreign assets become cheaper in relative terms"]

    C -->
    F["💵 Currency Effect<br/>The dollar can look stable<br/>while purchasing power erodes through asset inflation"]

    classDef prior fill:#dbeafe,stroke:#1d4ed8,stroke-width:2px,color:#111827;
    classDef current fill:#ffedd5,stroke:#ea580c,stroke-width:3px,color:#7c2d12;
    classDef effect fill:#dcfce7,stroke:#15803d,stroke-width:2px,color:#111827;

    class A,B prior;
    class C current;
    class D,E,F effect;
the fourth post will be explained later
6. The problem statement: the machine has too many plates
The problem is not simply that the United States has too much debt.
That is too vague.
The problem is that the U.S. fiscal machine now has to keep several unstable variables balanced at the same time.
It needs spending to continue, because the spending curve does not flatten.
It needs interest rates low enough that the debt stock can be rolled over without the interest bill exploding.
It needs inflation high enough to raise nominal GDP, nominal tax receipts, and asset prices.
It needs inflation low enough that the bond market does not revolt.
It needs the stock market high enough to support household wealth, confidence, capital gains, RSUs, options, bonuses, business valuations, pension assets, and federal income-tax receipts.
It needs AI and strategic companies to justify valuations that would look insane under normal earnings logic.
It needs foreign capital to keep buying U.S. assets.
It needs the dollar to remain trusted, even while the purchasing power of the dollar is being quietly diluted.
That is the balancing act.
The state is not trying to solve one problem.
It is trying to keep several plates spinning.
debt cannot grow too fast
interest cannot rise too far
inflation cannot fall too low
inflation cannot rise too high
stocks cannot fall too far
Treasury demand cannot break
AI valuations cannot lose credibility
the dollar cannot lose reserve status
This is why normal political language is misleading.
People talk as if the government has a clean menu of options:
cut spending
raise taxes
default
inflate
grow productivity
increase asset-linked revenue
But most of those options are either politically impossible, too slow, or systemically dangerous.
Cutting spending is politically brutal.
Raising taxes is politically dangerous.
Default is unthinkable.
Productivity growth takes time.
Inflation helps the debt, but damages trust.
Higher interest rates fight inflation, but worsen the debt-service problem.
Lower interest rates help debt service and asset prices, but risk reigniting inflation.
So the system reaches for the path that does the most things at once:
Keep rates lower than inflation would normally justify, keep the stock market high, let asset prices rise, and allow taxable income at the top to expand federal revenue without openly calling it a tax increase.
That is the hidden elegance of the mechanism.
It is not one policy.
It is a coordination problem.
The Treasury, the Fed, the White House, the stock market, the AI complex, and the largest companies all become part of the same machine.
The Treasury has to finance the deficit.
The Fed has to prevent inflation from breaking credibility while also preventing rates from breaking the fiscal system.
The White House needs the stock market as a political scoreboard.
The stock market needs a growth story large enough to absorb global capital.
The AI companies provide that story.
The mega-cap companies provide the index weight.
Foreign investors provide the demand.
And the tax system converts part of the resulting asset inflation into federal revenue.
That is the actual problem.
Not “how does the U.S. pay its debt?”
The deeper question is:
How does the U.S. keep the asset machine large enough to support the debt machine?
This is where the market concentration matters.
If the S&P 500 were rising because all 500 companies were growing together, that would suggest broad economic strength.
But if the index is being pulled upward by a small number of mega-cap companies, then something different is happening.
The market is not simply measuring the economy.
It is concentrating the economy into a handful of firms large enough to carry the index, attract global capital, justify AI infrastructure spending, and expand the asset base.
That is why we need to split the market in the model.
We should not only look at the S&P 500.
We should compare:
S&P 500 market-cap weighted
S&P 500 equal-weight
Magnificent Seven / top AI infrastructure complex
S&P 493
If the market-cap-weighted index rises while the equal-weight index stagnates, that tells us the growth is not broad.
It tells us the system is becoming more dependent on a narrow layer of companies.
That matters because the Asset-Tax Amplifier does not require every company to rise equally.
It only requires enough market-cap expansion at the top to create taxable income, capital gains, stock compensation, and confidence.
This is why the next phase of the model cannot simply ask:
How much must the stock market grow?
It has to ask:
Where must the stock market grow?
Because the fiscal machine does not need every stock to become more valuable.
It needs the taxable asset base to expand.
And in the modern U.S. market, that increasingly means the largest companies, the AI companies, the national champions, and the firms capable of carrying trillion-dollar valuations.
This is where the problem becomes uncomfortable.
The U.S. does not merely need a strong economy.
It needs a strong enough stock market.
It does not merely need a strong enough stock market.
It needs enough growth in the part of the stock market owned by the people who pay the most taxes.
And it does not merely need that growth to happen once.
It needs it to keep happening as spending rises, debt rolls over, and interest costs climb.
That is the machine.
The next section models how large the machine has to become.
6.1 The players/plates table
| Player | Plate they are juggling | What they need | Failure mode |
|---|---|---|---|
| Treasury | Deficit financing and debt rollover | Strong demand for Treasuries, manageable yields | Interest bill explodes |
| Fed | Inflation, rates, liquidity | Inflation tolerated but not uncontrolled; rates low enough not to break debt | Either inflation credibility breaks or asset/debt system breaks |
| White House | Political legitimacy | High stock market, strong nominal growth, visible prosperity | Market fall becomes political crisis |
| Stock market | Wealth, collateral, tax base | Rising valuations and liquidity | Capital gains/tax receipts weaken |
| Mega-cap companies | Index support | Earnings story, buybacks, AI capex credibility | Index loses narrow support |
| AI complex | Growth narrative | A believable productivity/infrastructure boom | Valuation story breaks |
| Foreign investors | Dollar recycling | U.S. assets remain the dominant place to park capital | Dollar/Treasury demand weakens |
| Tax system | Revenue conversion | Asset gains become taxable income | Revenue gap widens |
    flowchart LR
    A["🏛️ Treasury<br/>Finance deficits<br/>Roll debt"] --> H["⚖️ The Balancing Problem"]
    B["🏦 Fed<br/>Rates + inflation<br/>Liquidity backstop"] --> H
    C["🧢 White House<br/>Political scoreboard<br/>Market confidence"] --> H
    D["📈 Stock Market<br/>Wealth + collateral<br/>Taxable gains"] --> H
    E["🤖 AI Complex<br/>Growth story<br/>Capex justification"] --> H
    F["🏢 Mega-Caps<br/>Index weight<br/>Trillion-dollar containers"] --> H
    G["🌍 Foreign Capital<br/>Dollar recycling<br/>Asset demand"] --> H

    H --> I["🔥 Required Outcome<br/>Low-enough rates<br/>High-enough inflation<br/>High-enough stocks<br/>Believable-enough growth"]

    I --> J["💰 Asset-Tax Amplifier<br/>Stock gains become<br/>taxable federal revenue"]

    classDef actor fill:#dbeafe,stroke:#1d4ed8,stroke-width:2px,color:#111827;
    classDef balance fill:#ffedd5,stroke:#ea580c,stroke-width:3px,color:#7c2d12;
    classDef outcome fill:#dcfce7,stroke:#15803d,stroke-width:2px,color:#111827;
    classDef final fill:#fee2e2,stroke:#dc2626,stroke-width:3px,color:#7f1d1d;

    class A,B,C,D,E,F,G actor;
    class H balance;
    class I outcome;
    class J final;
7. Why Trump points at the stock market
Trump points at the stock market because he understands the dashboard.
This is not really about Trump.
He is simply more explicit than other presidents.
Every modern U.S. administration is constrained by the same pressure system. The difference is that Trump says the quiet part out loud. He treats the stock market as proof that the country is winning because, politically, that is increasingly how the American system behaves.
The stock market is not the whole economy.
But it has become the visible control panel.
It signals:
retirement confidence
consumer confidence
business confidence
capital gains
tax receipts
corporate financing
AI leadership
national prestige
dollar credibility
That is why market pressure changes political behaviour.
When a president announces an aggressive policy, markets immediately translate it into system pressure.
The pressure dashboard has four main dials:
| Dial | What it measures | Why it matters |
|---|---|---|
| S&P 500 | Asset prices and confidence | Falling stocks damage wealth, pensions, capital gains, and political legitimacy |
| 10-year Treasury yield | Cost of money | Rising yields increase borrowing costs and signal bond-market stress |
| Inflation | Cost-of-living pressure | High inflation hurts voters directly and limits the Fed’s ability to cut |
| Approval rating | Political tolerance | Weak polling reduces the president’s room to absorb economic pain |
This is the real point.
A president does not need to be secretly controlled by Wall Street for markets to discipline him.
The discipline is built into the system.
If stocks fall, yields rise, inflation stays high, and approval weakens, the political cost of extreme policy rises quickly. The president can still continue. But the system begins to push back.
That pushback is visible in the pattern:
aggressive policy threat
→ markets sell off
→ yields rise or liquidity tightens
→ inflation risk increases
→ approval pressure builds
→ policy softens, delays, or gets renamed
→ markets recover
That is not weakness in the personal sense.
It is system pressure.
The stock market matters here because it is the fastest-moving political signal. Polls lag. Economic data lags. Tax receipts lag. But the market reprices instantly.
This makes the S&P 500 a real-time referendum on policy.
That does not mean the market is always right.
It means the market is fast.
And in a system where asset prices support tax revenue, household wealth, corporate financing, and political legitimacy, a fast signal becomes a powerful signal.
This is why Trump keeps returning to the market.
He treats it as the score because the system has made it the score.
But the deeper point is that the score itself has changed.
In an older economy, a president could point to wages, factories, employment, trade balances, or production.
In the current system, the headline market index has become the compressed signal for everything the state needs to preserve:
wealth
confidence
liquidity
tax receipts
capital formation
AI investment
dollar demand
That is why this post keeps coming back to the stock market.
Not because the stock market represents ordinary life.
It does not.
But because it represents the part of the system that the state cannot easily allow to break.
Once the market falls far enough, it stops being a market event.
It becomes a political event.
Then a fiscal event.
Then a policy event.
That is the feedback loop.
Trump sees the dashboard.
The market sees that he sees it.
And once markets believe a president has a pain threshold, they begin trading against that threshold.
That is how a market becomes a policy constraint.
8. The Asset-Tax Amplifier
This is the heart of the analysis.
Everything before this section points here.
The debt is the stock.
Interest is the pressure.
Revenue is the oxygen.
And the stock market is the amplifier inside the largest revenue pipe.
That is the system.
The United States can carry a large debt burden as long as the revenue system can support the interest cost. The debt itself is not the immediate problem. The problem is what happens when the interest bill grows faster than the state’s ability to collect revenue.
That is why federal revenue matters so much.
And the largest source of federal revenue is individual income tax.
Not corporate tax.
Not tariffs.
Not customs duties.
Individual income tax.
That means the fiscal survival of the U.S. state depends heavily on the income-tax pipe.
But that pipe is not evenly distributed.
It is concentrated at the top.
And the top of the income distribution is where the stock market lives.
Capital gains.
RSUs.
Stock options.
Bonuses.
Executive compensation.
Business equity.
Taxable investment income.
High-end consumption.
That is the bridge.
The stock market does not appear in the federal accounts as a line item called “stock-market revenue.” It is more hidden than that. It flows through individual income tax.
When the stock market rises, the asset-owning class gets richer. Some of that wealth remains unrealised, but enough becomes taxable to matter.
Capital gains are realised.
Options are exercised.
RSUs vest.
Bonuses expand.
Business valuations rise.
Founders sell shares.
Executives pay tax on compensation.
High-end spending continues.
Some of that private asset inflation becomes public revenue.
That is the Asset-Tax Amplifier.
stock market rises
→ asset-owning households become richer
→ capital gains, RSUs, options, bonuses, and business income rise
→ top-decile taxable income rises
→ individual income-tax receipts strengthen
→ federal revenue improves
→ debt-service pressure becomes easier to manage
And the reverse is just as important:
stock market falls hard
→ capital gains collapse
→ stock compensation loses value
→ bonuses compress
→ business valuations fall
→ taxable high-end income weakens
→ individual income-tax receipts weaken
→ deficit pressure worsens
→ policy is pulled toward intervention
This is why a prolonged market crash is no longer just a market event.
It becomes a revenue event.
Then a deficit event.
Then a debt-service event.
Then a policy event.
That is the loop.
The stock market is not merely enriching the wealthy.
It is feeding the state.
The important point is not that all federal revenue comes from stocks. It does not.
The point is more precise:
The largest federal revenue pipe is individual income tax, and the volatile upside of that pipe is highly exposed to asset prices.
That is what changes the whole system.
If interest costs are stable, the Asset-Tax Amplifier is helpful but not existential.
But if interest costs double over the next five to ten years, the amplifier becomes structurally important.
The state cannot easily double payroll taxes.
It cannot easily double corporate taxes.
It cannot easily double tariffs without breaking trade and raising inflation.
It cannot easily cut spending enough to offset the interest curve.
So the system looks for the one revenue channel that can expand without being announced as a tax increase.
Asset prices.
Push the market higher.
Let taxable gains appear.
Let compensation rise.
Let the top decile carry more of the revenue load.
Let the stock market grow into the gap.
That is the mechanism this post is modelling.
The next section does not ask whether the stock market is high.
It asks something more uncomfortable:
How high does the stock market need to go to keep the U.S. fiscal machine ahead of the interest curve?
Because if interest doubles, revenue has to grow somewhere.
And if ordinary revenue cannot grow fast enough, the system must either accept constraint, impose pain, or inflate the asset base.
That is why the stock market matters.
It is no longer just a scoreboard.
It is no longer just a casino.
It is no longer just Wall Street wealth.
It is a fiscal support structure.
And once a market becomes part of the revenue system, policymakers stop treating it like a normal market.
9. The model: what we asked the AI to calculate
This is where the post stops being an argument and becomes a model.
Everything up to this point has been setup.
We know the problem.
The U.S. has rising debt.
It has rising interest costs.
It has spending that does not flatten.
It has inflation above target.
It has a federal revenue system heavily dependent on individual income taxes.
And the volatile upside of that tax pipe is exposed to asset prices.
So the question becomes quantifiable.
If interest costs rise faster than normal federal revenue, how much must the stock market grow to keep the U.S. fiscal machine stable?
That is what we asked the model to calculate.
We used AI not to predict the market, but to build a stress harness.
The model has one purpose:
Show when the system leaves normal ranges.
The inputs are simple:
starting federal revenue
starting federal debt
current net interest cost
normal revenue growth rate
normal debt growth rate
effective rollover interest rate
asset-sensitive tax base
target interest/revenue ratio
The interest-rate scenarios are:
4%
5%
7.5%
10%
12%
The time horizons are:
1 year
5 years
10 years
The inflation assumption is also important.
We assume inflation remains around 4%.
That means the model gives the government credit for nominal revenue growth. It does not assume deflation. It does not assume collapse. It assumes inflation helps lift nominal tax receipts.
Even with that help, the system becomes strained quickly.
The core question is:
How much must the stock market grow to produce enough asset-sensitive tax revenue to stop interest from consuming a larger share of federal revenue?
That is the Required Market Curve.
It is the curve this post has been building toward.
10. The maths
The model uses a deliberately simple structure.
First, debt grows over time:
Debt(t) = Debt(0) × (1 + debt_growth_rate)^t
Then we apply an effective interest rate:
Interest(t) = Debt(t) × effective_interest_rate
Revenue grows with inflation and nominal activity:
Revenue(t) = Revenue(0) × (1 + normal_revenue_growth_rate)^t
We then preserve the current interest burden as the target ratio:
TargetInterest(t) = Revenue(t) × current_interest_to_revenue_ratio
The model then calculates the gap:
RevenueGap(t) = Interest(t) - TargetInterest(t)
Finally, we ask how much the asset-sensitive tax base would need to expand to close that gap:
RequiredMarketMultiple =
    1 + RevenueGap(t) / AssetSensitiveTaxBase
This is not a precise Treasury maturity model.
A full model would include:
bill / note / bond maturity schedule
weighted-average maturity
coupon structure
new issuance
inflation-indexed debt
foreign demand
Federal Reserve balance-sheet policy
tax-realisation behaviour
market drawdowns
That is not the goal here.
The purpose of this model is not exact accounting.
The purpose is to expose scale.
A model does not need to be perfect to be useful.
It only needs to show when the system leaves normal operating range.
And under higher effective interest rates, it does.
At 4%, the system is already approaching constraint.
At 5%, the interest burden becomes meaningfully uncomfortable.
At 7.5%, the burden becomes severe.
At 10% or 12%, the model stops looking like normal public finance and starts looking like emergency fiscal arithmetic.
That is the point.
11. The result: the Required Market Curve
The AI generated the Required Market Curve.
This is the point where the argument stops being conceptual and becomes visual.
The curve answers a specific question:
How much does the stock-market-linked tax base need to expand to stop interest from consuming a larger share of federal revenue?
To make the result as clear as possible, I show the model two ways.
First, using debt held by the public — the cleaner measure of market-facing debt, and the fairest base for a refinancing and interest-rate stress model.
Second, using gross federal debt — the larger headline number that includes intragovernmental holdings, and the number most readers think of when they hear that U.S. debt is approaching $40 trillion.
This matters because both numbers are real, but they describe different layers of the system.
The result is stark.
At a 5% effective interest rate, the required market expansion is already large. The asset-sensitive tax base has to grow aggressively just to keep the interest-to-revenue ratio flat.
At 7.5%, the system becomes extreme. The market has to do far more than reflect economic growth. It has to carry fiscal pressure.
At 10%, the model starts producing numbers that are difficult to reconcile with traditional valuation logic. The required expansion pushes toward permanent, aggressive multiple growth.
And when the model is run against the full gross-debt headline, the required expansion becomes even more severe.
That is the point of the curve.
It is not predicting that the market will literally rise by one exact multiple.
It is showing the size of the fiscal burden the market is being asked to absorb.
The higher the interest rate, the less the economy looks like capitalism and the more it looks like a machine searching for collateral.
The chart below makes that visible.
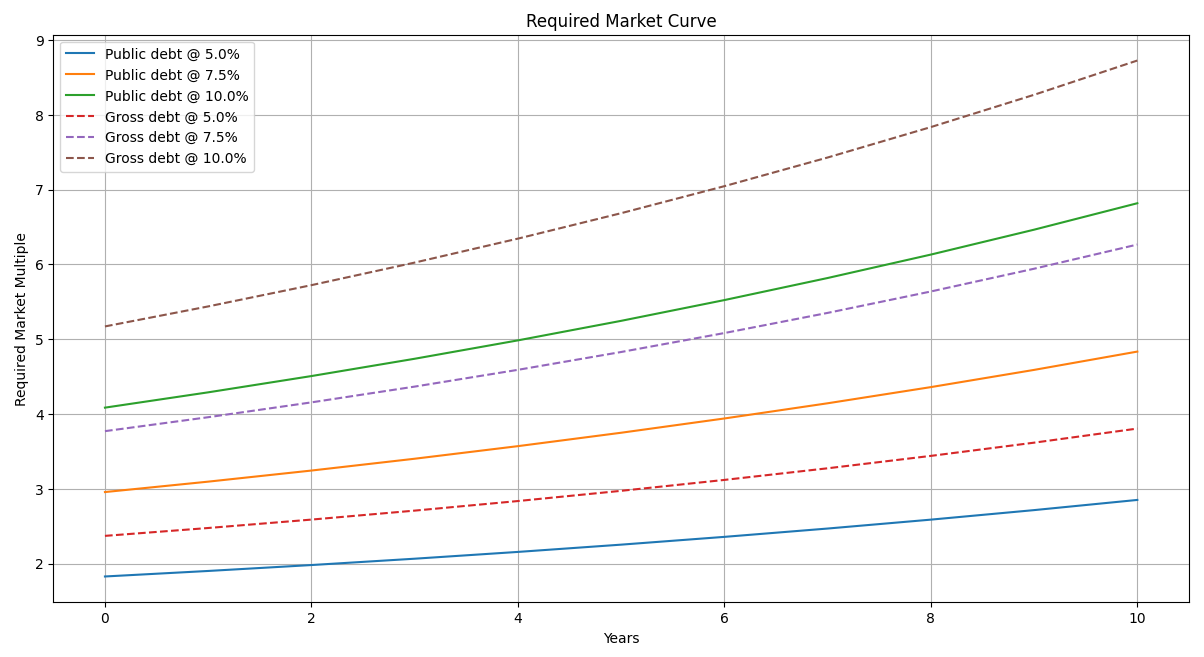
| Horizon | Public debt @ 5% | Public debt @ 7.5% | Public debt @ 10% | Gross debt @ 5% | Gross debt @ 7.5% | Gross debt @ 10% |
|---|---|---|---|---|---|---|
| 1 year | 1.9x | 3.1x | 4.3x | 2.4x | 3.9x | 5.4x |
| 5 years | 2.3x | 3.8x | 5.3x | 3.0x | 4.8x | 6.7x |
| 10 years | 2.9x | 4.8x | 6.8x | 3.9x | 6.3x | 8.8x |
The chart makes the pressure visible.
Under the public-debt model, a 5% effective interest-rate environment already requires a substantial expansion of the market-linked tax base. At 7.5%, the burden becomes extreme. At 10%, the market is no longer being asked merely to reflect economic growth. It is being asked to absorb fiscal strain.
Under the gross-debt version, the same pattern becomes even more severe. That does not mean gross debt is the correct market-refinancing base. It means the broader promise stack of the U.S. state is even larger than the fair market-facing model suggests.
Either way, the conclusion is the same:
The higher the interest rate, the more the system depends on asset inflation to keep the fiscal machine stable.
12. The reverse model: what happens if the stock market falls?
The Required Market Curve shows the upside pressure.
It asks how much the stock-market-linked taxable base must expand to keep the interest/revenue ratio stable.
But there is a second curve.
The panic curve.
What happens if the stock market falls?
This matters because if the market is part of the revenue system, then a market crash is not only a private-wealth event.
It becomes a fiscal event.
The model keeps the same basic assumptions:
starting federal revenue
debt held by the public
normal revenue growth
normal debt growth
effective interest rate
asset-sensitive tax base
But instead of asking how much the market must rise, we ask what happens if the market falls sharply over two quarters.
The shock scenarios are:
-10%, then -10%
-20%, then flat
-20%, then -20%
Because losses compound, the cumulative declines are:
| Market path | Cumulative decline |
|---|---|
| -10%, then -10% | -19% |
| -20%, then flat | -20% |
| -20%, then -20% | -36% |
The important point is that the tax effect is not necessarily linear.
If the stock market falls 20%, asset-linked tax receipts may not fall by exactly 20%.
They can fall by more.
Capital gains can disappear.
Stock options can go underwater.
RSUs vest at lower values.
Bonuses compress.
Founders delay selling.
Loss harvesting increases.
Business valuations fall.
High-end spending slows.
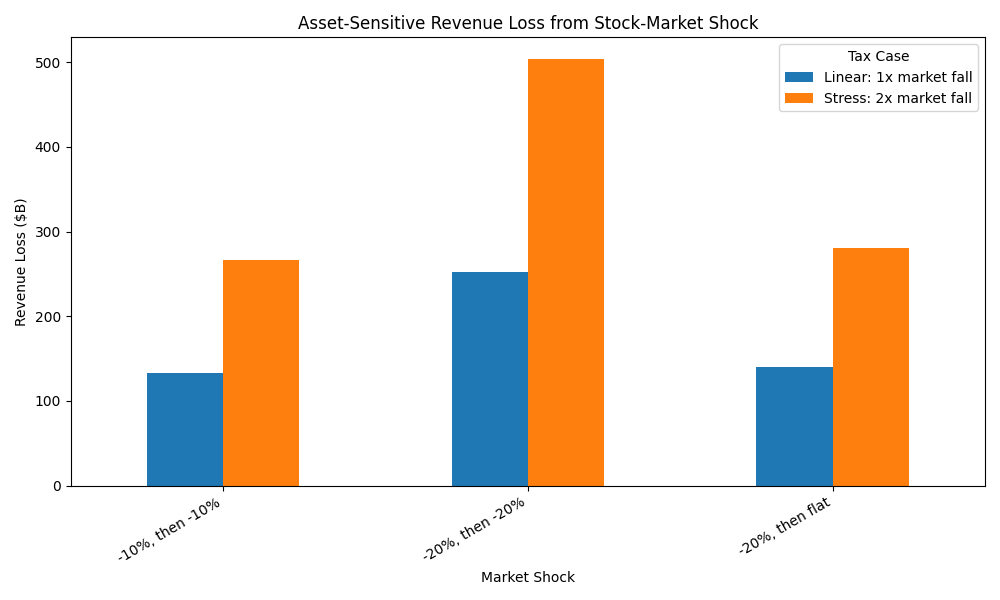
So the model uses two versions:
Linear case: asset-sensitive receipts fall in line with the market
Stress case: asset-sensitive receipts fall at 2x the market decline
Using an asset-sensitive tax base of $700 billion, the downside revenue shock looks like this:
| Market shock | Linear revenue loss | Stress revenue loss |
|---|---|---|
| -10%, then -10% | -$133B | -$266B |
| -20%, then flat | -$140B | -$280B |
| -20%, then -20% | -$252B | -$504B |
That is the first result.
A serious market fall can remove hundreds of billions of dollars from the most volatile part of the federal revenue system.
By itself, that does not collapse the state.
But it matters because it happens at exactly the wrong moment.
A market crash usually does not arrive alone.
It tends to arrive with weaker confidence, weaker growth expectations, tighter credit, lower capital gains, lower bonuses, and pressure on financial conditions.
Now combine that revenue shock with higher effective interest rates.
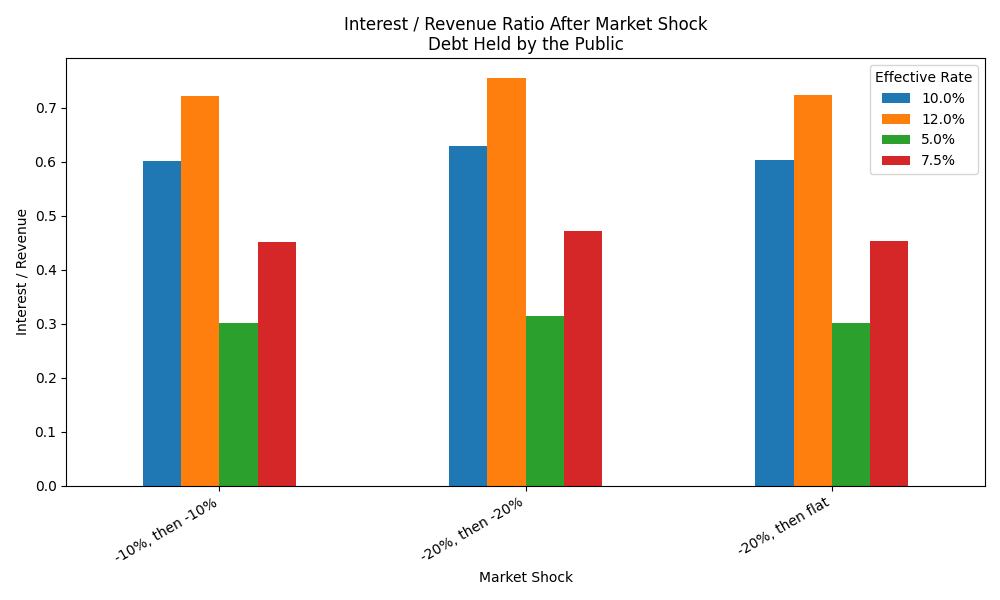
Using debt held by the public as the main model, the interest/revenue ratio after the stress-case market shock becomes:
| Market shock | 5% rate | 7.5% rate | 10% rate | 12% rate |
|---|---|---|---|---|
| -10%, then -10% | 30% | 45% | 60% | 72% |
| -20%, then flat | 30% | 45% | 60% | 72% |
| -20%, then -20% | 31% | 47% | 63% | 75% |
This is the panic curve.
At 5%, the system is already above the warning zone.
At 7.5%, interest starts consuming nearly half of federal revenue.
At 10%, interest consumes more than 60% of revenue after the shock.
At 12%, the model is no longer describing normal fiscal politics.
It is describing emergency arithmetic.
And if we run the same calculation against gross federal debt — the broader headline debt number approaching $40 trillion — the stress becomes even more severe:
| Market shock | 5% rate | 7.5% rate | 10% rate | 12% rate |
|---|---|---|---|---|
| -10%, then -10% | 37% | 56% | 75% | 90% |
| -20%, then flat | 37% | 56% | 75% | 90% |
| -20%, then -20% | 39% | 59% | 78% | 94% |
That does not mean gross debt is the cleanest refinancing base.
It is not.
Debt held by the public is the fairer market-facing model.
But the gross-debt version shows why the headline number still matters politically. It shows the size of the whole promise stack.
Either way, the conclusion is the same.
A falling stock market hits the system twice.
market falls
→ asset-linked tax receipts weaken
→ revenue falls
→ interest/revenue ratio worsens
→ deficit pressure rises
→ borrowing need rises
→ policy pressure increases
This is the reverse Asset-Tax Amplifier.
When the market rises, the amplifier helps the state.
When the market falls, the amplifier runs backward.
And when it runs backward while interest costs are rising, the system can deteriorate quickly.
That is why policymakers panic when markets fall hard.
Not because every investor must be protected.
Not because stocks are morally important.
But because a prolonged market decline damages the same revenue pipe the state needs to service the debt.
The upside model shows why the market has to grow.
The downside model shows why the market cannot be allowed to fall too far.
That is when a market event becomes a fiscal event.
Revenue Loss from a Market Shock
Interest / Revenue Ratio After Market Shock (Public Debt)
Interest / Revenue Ratio After Market Shock (Gross Federal Debt)

13. When does it become a problem?
The model does not say the system breaks because debt is high.
High debt is survivable if revenue grows fast enough.
It does not say the system breaks because stock valuations are high.
High valuations are survivable if earnings eventually arrive.
It does not say the system breaks because inflation stays above target.
Inflation is survivable if trust remains and the bond market keeps funding the state.
The problem begins when all three lines start moving against each other.
interest grows faster than revenue
asset-sensitive tax receipts cannot close the gap
market valuations exceed believable earnings growth
That is the danger point.
The U.S. can survive high debt.
It can survive high valuations.
It can survive inflation.
It cannot easily survive a situation where the debt needs the market to rise faster than earnings can justify, while inflation remains too high for easy rate cuts, while interest costs consume a rising share of federal revenue.
That is when the system leaves normal ranges.
This is the phase the AI stress-test is trying to identify.
Not collapse.
Constraint.
Collapse is dramatic. Constraint is quieter.
Constraint means the state still functions, but its choices narrow.
More revenue is pre-committed to interest.
More policy becomes market-sensitive.
More growth has to come from asset inflation.
More of the economy becomes dependent on a small number of companies carrying the index.
More political pressure builds around rates, liquidity, and stock prices.
The machine still runs.
But it has less room.
That is why the Required Market Curve matters.
At low effective interest rates, the market can behave like a market.
It can rise, fall, reprice, correct, and recover.
But as the effective interest rate rises, the market is asked to do more.
It is no longer merely reflecting expected profits.
It is helping support the fiscal machine.
At 5%, the requirement is uncomfortable.
At 7.5%, it becomes extreme.
At 10%, the market is being asked to absorb a burden that ordinary earnings growth may not be able to carry.
That is the critical transition.
The crisis is not high debt.
The crisis is not high stock prices.
The crisis is not inflation by itself.
The crisis is the moment the required market growth rate becomes larger than the believable earnings growth rate.
required market growth > believable earnings growth
That is when valuation stops being optimism and starts becoming system requirement.
This is the uncomfortable part.
If the market rises because earnings are rising, that is capitalism.
If the market rises because productivity is rising, that is growth.
If the market rises because innovation is creating real cash flows, that is value creation.
But if the market has to rise because the fiscal system needs the asset base to expand, then the market is no longer just pricing the future.
It is being recruited to finance the present.
That is where the Asset-Price State becomes visible.
It is not a formal policy.
It is not announced.
It is not written down as a programme.
But the incentives all point in the same direction.
The Treasury needs manageable funding conditions.
The Fed needs to avoid breaking the debt machine.
The White House needs the market high.
The tax system benefits when asset-linked income expands.
Mega-cap companies provide the scale.
AI provides the growth story.
Foreign capital provides the demand.
And the stock market becomes the place where all those pressures meet.
The danger point arrives when the story can no longer carry the numbers.
When earnings cannot justify the required multiple.
When AI capex cannot justify the valuation.
When inflation cannot be tolerated without damaging trust.
When rates cannot rise without damaging debt service.
When rates cannot fall without reigniting inflation.
When the market cannot fall without damaging revenue.
That is the box.
And once the system is inside that box, every policy choice becomes a trade-off between different forms of instability.
raise rates
→ protect inflation credibility
→ worsen debt service
→ pressure stocks

cut rates
→ protect debt service and stocks
→ risk inflation and dollar credibility

let stocks fall
→ restore valuation discipline
→ weaken tax receipts and confidence

support stocks
→ preserve the fiscal amplifier
→ deepen dependency on asset inflation
This is when the stock market stops looking like a normal market.
It becomes a load-bearing structure.
That does not mean stocks only go up.
It means large drawdowns become harder for the system to tolerate.
It means policy reacts faster.
It means liquidity support becomes easier to justify.
It means AI, mega-cap technology, defence, infrastructure, and national champions become more politically important.
It means the market becomes part of the state’s survival architecture.
That is the real problem.
Not that the market is high.
But that the market may now need to stay high.
And not merely stay high.
It may need to keep rising faster than the real economy can justify.
That is the constraint the model exposes.
| Condition | Normal version | Danger version |
|---|---|---|
| Debt | High, but serviceable | Interest grows faster than revenue |
| Stocks | Expensive, but earnings catch up | Required market growth exceeds believable earnings growth |
| Inflation | Above target, but trusted | Inflation needed for debt relief but damages credibility |
| Policy | Has room to tighten or loosen | Every move breaks another plate |
| AI narrative | Supports growth expectations | Becomes required to justify fiscal-scale valuations |
The problem begins when the market is no longer pricing growth, but being asked to manufacture fiscal capacity.
14. AI as the valuation excuse
This is where the AI narrative becomes structurally vital.
In a previous post, I argued that AI is increasingly being deployed as a technology of managed continuity.
Not collapse.
Not utopia.
Continuity.
AI appears everywhere because modern systems are under pressure everywhere: debt pressure, demographic pressure, wage pressure, energy pressure, institutional pressure, information pressure.
AI helps those systems measure more, optimise faster, compress costs, coordinate complexity, and preserve functionality.
That was the first layer.
This post adds the second layer.
AI is not only a continuity technology.
It is also a valuation technology.
The model shows why this matters.
If interest costs rise faster than normal revenue, the system needs asset prices to do more work. It needs the stock market to rise. It needs the asset-sensitive tax base to expand. It needs the largest companies to become larger. It needs the index to keep carrying wealth, confidence, capital gains, stock compensation, and federal receipts.
But markets cannot rise forever on fiscal need alone.
They need a story.
AI supplies that story.
productivity boom
automation
robotics
defence systems
data centres
energy demand
model infrastructure
software replacement
national competitiveness
This is why AI matters so much in the current market structure.
It is not just another technology cycle.
It is the only story large enough to justify the scale of market expansion the system now needs.
A normal software cycle is not enough.
A new phone cycle is not enough.
A better advertising model is not enough.
The market needs something larger.
It needs a story that can justify trillion-dollar companies becoming even larger.
It needs a story that can justify enormous data-centre spending.
It needs a story that can justify chip shortages, energy infrastructure, cloud expansion, defence integration, robotics, automation, and national-security investment.
It needs a story big enough to carry the index.
AI is that story.
This does not mean AI is fake.
That is the wrong argument.
AI may be real.
AI may be transformative.
AI may genuinely change software, labour, defence, education, logistics, medicine, manufacturing, administration, and energy demand.
But the fiscal system also needs AI to be real enough to justify the valuation regime.
That is the important distinction.
There is a difference between:
AI as technology
and:
AI as valuation permission
AI as technology asks:
What can these systems actually do?
AI as valuation permission asks:
What future cash flows can the market justify pricing today?
Those are not the same question.
And right now, the second question is doing enormous work.
AI allows the market to say:
yes, valuations are high
but productivity will rise

yes, capex is extreme
but infrastructure demand will explode

yes, labour is expensive
but automation will compress costs

yes, energy demand is rising
but that proves the scale of the boom

yes, mega-caps dominate the index
but they are the only companies large enough to build the future
This is why AI becomes more than a sector.
It becomes the narrative bridge between impossible numbers and believable markets.
Without AI, the Required Market Curve looks absurd.
With AI, the market gets a reason to suspend disbelief.
That does not mean the belief is wrong.
It means the belief is now load-bearing.
The AI story supports mega-cap valuations.
Mega-cap valuations support the S&P 500.
The S&P 500 supports household wealth, confidence, capital gains, stock compensation, and federal tax receipts.
Federal tax receipts support the debt-service machine.
That is the loop.
AI narrative
→ mega-cap valuation
→ index strength
→ asset-sensitive taxable income
→ federal revenue
→ debt-service support
This is where the two posts connect.
In the earlier post, AI appeared as managed continuity: a technology used by constrained systems to keep operating.
In this post, AI appears as valuation continuity: a story used by financial markets to keep pricing a future large enough to support the present.
Those are not separate arguments.
They are the same argument seen from different levels of the system.
Operationally, AI helps institutions manage constraint.
Financially, AI helps markets deny constraint.
That is why the timing matters.
AI arrives at the exact moment the old growth model is becoming harder to sustain.
Cheap debt is gone.
Demographic momentum is weaker.
Energy demand is rising.
Institutions are overloaded.
Interest costs are climbing.
The stock market needs a growth story big enough to carry extreme valuations.
And suddenly AI appears as the answer to almost every pressure point at once.
It promises productivity.
It promises labour compression.
It promises defence advantage.
It promises administrative efficiency.
It promises software replacement.
It promises energy demand large enough to justify new infrastructure.
It promises national competitiveness.
It promises growth without admitting that the old growth model is failing.
That is why AI is so useful to the system.
It is not only a tool.
It is an explanation.
It tells investors why valuations can stay high.
It tells companies why capex can explode.
It tells governments why industrial policy matters.
It tells voters that productivity is coming.
It tells markets that the future will be large enough to pay for the present.
That may be true.
But it has to become true.
That is the dangerous part.
AI now carries two burdens at once.
It has to become a real technology.
And it has to justify the market structure built on top of it.
If AI delivers slowly, the valuation story weakens.
If the valuation story weakens, the mega-caps weaken.
If the mega-caps weaken, the index weakens.
If the index weakens, the Asset-Tax Amplifier weakens.
And if the Asset-Tax Amplifier weakens while interest costs are rising, the fiscal machine loses one of its easiest support mechanisms.
That is why the AI trade is not just a technology trade.
It is a fiscal trade.
It is a dollar trade.
It is a state-capacity trade.
It is the market trying to believe in a future large enough to pay for the present.
AI may be the technology.
But it is also the story that allows the valuation regime to continue.
15. SpaceX and the national champion model
SpaceX is the perfect case study for this dynamic.
Not because it is fake.
That is not the argument.
SpaceX is obviously real. It launches rockets. It operates satellites. It has strategic value. It has military value. It has communications value. It has infrastructure value. It has national-prestige value.
That is exactly the point.
It is not being valued like a normal company because it is no longer being understood as a normal company.
It is being priced as a container for future strategic value.
launch capacity
satellite infrastructure
military communications
space logistics
national prestige
geopolitical leverage
future AI infrastructure
strategic optionality
In a normal valuation framework, the numbers are hard to justify.
At its IPO valuation, SpaceX was being priced at roughly ninety times trailing revenue. Not earnings. Revenue.
And the company had recently reported a multi-billion-dollar net loss.
In ordinary market conditions, that would look absurd.
A company trading at nearly one hundred times sales, with no conventional earnings support, would normally be treated as speculative excess.
But this is not an ordinary market condition.
That is the whole point of this post.
The market is not only pricing current cash flows.
It is pricing national necessity.
It is pricing strategic optionality.
It is pricing the possibility that SpaceX becomes one of the few private companies large enough to absorb trillions of dollars of valuation and still sound plausible.
That matters because the existing market is running out of believable containers.
Microsoft cannot grow tenfold from here under normal fundamentals.
Apple cannot grow tenfold from here under normal fundamentals.
Nvidia cannot carry the entire system forever.
The Magnificent Seven can support the index for a while, but if the Required Market Curve keeps rising, even they may not be enough.
So the market needs new containers.
It needs companies that can plausibly hold impossible valuations.
Not because the numbers already work.
But because the story is large enough.
That is why frontier assets matter.
AI
space
defence
energy infrastructure
robotics
satellite networks
sovereign cloud
data-centre empires
military communications
off-world compute
These are not normal sectors.
They are valuation frontiers.
They allow the market to say:
This is not just a company. This is infrastructure. This is national power. This is the future operating system of the state.
That changes the valuation logic.
A normal company is valued on earnings.
A growth company is valued on future earnings.
A national champion is valued on strategic necessity.
That is the new category.
SpaceX is not valued like a company.
It is valued like a piece of state infrastructure with private shareholders.
And once you understand that, the valuation starts to make sense in a different way.
Not as traditional finance.
As system finance.
The U.S. stock market needs assets large enough to carry global capital.
The fiscal system needs asset prices high enough to support the tax amplifier.
The political system needs symbols of national dominance.
The military system needs private infrastructure it can use without fully owning.
The AI system needs energy, compute, satellites, and frontier-scale ambition.
SpaceX sits at the intersection of all those needs.
That is why the market can price it at a level that looks irrational under ordinary accounting.
The accounting is not the product.
The strategic story is the product.
This is the national champion model.
A company becomes so entangled with state capacity, military logistics, communications, infrastructure, and future technology that the market stops asking only:
What did it earn last year?
And starts asking:
What part of the future state could this company own?
That is how impossible valuations become narratively possible.
This does not mean the valuation is safe.
It may be wildly dangerous.
It may be a bubble.
It may disappoint.
It may collapse if the story weakens.
But the function is clear.
The system needs frontier assets because ordinary assets are no longer large enough to absorb the required growth.
If the market has to double, triple, or quadruple under fiscal pressure, it cannot do that through ordinary companies selling ordinary products at ordinary margins.
It needs Star Trek assets.
It needs assets where the future is so large, so vague, so strategic, and so difficult to model that valuation discipline becomes suspended.
SpaceX gives the market that.
AI gives the market that.
Defence technology gives the market that.
Sovereign infrastructure gives the market that.
They are not just businesses.
They are valuation containers for a system that needs the asset base to keep expanding.
This is the deeper point.
When the required market growth rate exceeds believable earnings growth, the market does not immediately admit defeat.
It searches for a bigger story.
AI is one story.
SpaceX is another.
The national champion is the structure that joins them together.
That is why these companies matter so much.
They let the market price the future as if it is large enough to pay for the present.
At IPO pricing, the valuation was already close to 100x trailing revenue. If the stock trades materially above the IPO price, the sales multiple moves well beyond 100x. That is why the exact day-to-day market cap is less important than the valuation regime itself.
| Company type | Normal valuation anchor | New valuation anchor |
|---|---|---|
| Traditional company | Earnings, margins, cash flow | Business performance |
| Growth company | Future earnings | Market share and expansion |
| Mega-cap platform | Ecosystem control | Index weight and global capital absorption |
| AI infrastructure company | Future productivity | Compute, data, energy, automation |
| National champion | Strategic necessity | State capacity, defence, infrastructure, geopolitical leverage |
16. “Our currency, your problem”
John Connally famously told the world:
The dollar is our currency, but your problem.
That line belongs to the old dollar system.
But the new version is subtler.
It is not only about printing dollars.
It is not only about devaluing the currency.
It is not only about exporting inflation through the reserve-currency system.
The newer mechanism runs through asset prices.
inflate U.S. asset prices
→ increase U.S. tax receipts
→ increase U.S. corporate purchasing power
→ preserve U.S. strategic firms
→ allow U.S. companies to buy global assets
→ force foreign investors to chase U.S. markets
→ weaken foreign competitors by comparison
This is harder to see because it does not look like a currency crisis.
The dollar can remain strong on a foreign-exchange chart while the price of strategic U.S. assets rises faster than almost everything else.
That is still a form of devaluation.
Not a visible devaluation against the euro, yen, or pound.
A devaluation through the asset base.
The old mechanism was:
print dollars
devalue currency
export inflation
The new mechanism is:
inflate U.S. equities
expand the asset-tax base
strengthen federal receipts
increase corporate purchasing power
turn U.S. firms into global acquisition machines
This is where the scale becomes difficult to process.
A single U.S. frontier company can now be valued at the scale of an entire developed-country stock market.
That does not mean the company can literally buy the country.
Market cap is not cash.
A sovereign state is not for sale.
Political control, regulation, national security, ownership restrictions, and real-world integration all matter.
But as a valuation comparison, the signal is extraordinary.
When one U.S. company can be valued at roughly the same scale as the listed equity market of a major developed economy, something larger than ordinary company analysis is happening.
The United States is not merely creating companies.
It is creating valuation weapons.
That is the deeper meaning of SpaceX, AI mega-caps, defence technology, sovereign cloud, data-centre empires, and national champions.
They are not just businesses.
They are containers for strategic valuation.
And once those containers exist, they change the global balance of power.
A highly valued U.S. company can use its equity, its access to capital, its political importance, and its market credibility to buy assets abroad.
Not necessarily entire countries.
But infrastructure.
Talent.
Suppliers.
Energy assets.
Defence contractors.
Satellite capacity.
Software firms.
Robotics companies.
Data-centre sites.
Mineral rights.
AI labs.
The inflated U.S. asset base becomes purchasing power.
That is the key.
When U.S. valuations rise far beyond foreign valuations, the U.S. does not merely become richer on paper.
Its companies gain relative purchasing power.
Foreign assets become cheap by comparison.
A U.S. company trading at one hundred times sales can buy a foreign company trading at two times sales and call it strategic expansion.
That is not just a market transaction.
It is valuation arbitrage.
The U.S. exports valuation pressure through the stock market.
Foreign investors face the same pressure.
If they stay out of U.S. markets, they risk underperforming.
If they enter U.S. markets, they help push U.S. valuations higher.
If U.S. valuations go higher, U.S. companies gain even more purchasing power.
The loop closes.
foreign capital flows into U.S. equities
→ U.S. valuations rise
→ U.S. companies gain acquisition power
→ foreign assets look cheap
→ U.S. strategic reach expands
→ foreign investors chase U.S. assets harder
This is not traditional empire.
It is index empire.
It is not conquest by armies.
It is conquest by valuation spread.
That is why the dollar system matters.
The rest of the world cannot simply ignore U.S. markets.
The dollar remains the dominant reserve and funding currency.
U.S. equities remain the deepest capital pool.
U.S. mega-caps dominate global index weight.
U.S. technology firms define the growth narrative.
U.S. financial markets absorb global savings.
So when the U.S. inflates its asset base, the world is pulled into the repricing.
This is the new version of Connally’s line.
The dollar is still America’s currency.
But now the U.S. stock market is also your problem.
Because if U.S. valuations inflate, everyone else has to respond.
Foreign companies become acquisition targets.
Foreign investors have to chase U.S. assets.
Foreign governments worry about losing strategic firms.
Foreign stock markets look smaller.
Foreign currencies look weaker in asset terms.
Foreign productivity stories look less convincing.
And foreign capital keeps being pulled back into the U.S. machine.
This is why the post cannot stop at federal revenue.
The Asset-Tax Amplifier is domestic.
But the valuation system is global.
Inside the United States, asset inflation supports tax receipts and debt service.
Outside the United States, asset inflation increases American purchasing power and forces the rest of the world to compete with U.S. valuations.
That is the deeper mechanism.
The U.S. does not only export inflation through the dollar.
It exports valuation pressure through the stock market.
| Mechanism | Old dollar system | New asset-price system |
|---|---|---|
| Main instrument | Dollar issuance | U.S. equity valuation |
| Pressure channel | Currency devaluation | Valuation spread |
| Domestic benefit | Debt diluted through inflation | Tax receipts strengthened through asset gains |
| Global effect | Inflation exported through dollar system | Foreign assets become cheap relative to U.S. equities |
| Corporate effect | U.S. firms borrow in deep capital markets | U.S. firms use inflated equity as acquisition power |
| Political effect | Dollar dominance preserved | National champions become strategic infrastructure |
17. The global consequence: everyone else gets repriced
The domestic mechanism is the Asset-Tax Amplifier.
The global mechanism is valuation pressure.
If U.S. companies trade at extreme multiples while foreign companies trade at normal multiples, the entire world gets repriced around the U.S. market.
That does not mean every foreign company is weak.
Many are profitable.
Many are productive.
Many are strategically important.
Many are better businesses than their valuations suggest.
But that may not matter.
If the U.S. market is willing to price national champions, AI infrastructure, defence technology, data centres, software platforms, chip companies, and space infrastructure at extreme multiples, then foreign companies are forced into a different relative position.
They become cheap.
Not necessarily cheap in absolute terms.
Cheap in comparison.
That comparison changes everything.
U.S. company trades at extreme multiple
→ foreign company trades at normal multiple
→ U.S. company gains relative purchasing power
→ foreign company becomes acquisition target
→ foreign investors chase U.S. market instead
→ foreign market looks structurally discounted
This is how asset inflation becomes acquisition power.
An overvalued U.S. company can use its stock, capital access, dollar liquidity, market prestige, and strategic backing to buy real foreign assets.
It can buy suppliers.
It can buy technology.
It can buy talent.
It can buy infrastructure.
It can buy strategic optionality.
It can buy tomorrow’s bottlenecks.
A European firm may have real earnings, real customers, real factories, real intellectual property, and real strategic value. But if it trades at a low multiple while a U.S. national champion trades at a fantasy multiple, the U.S. firm has the stronger acquisition currency.
That is the global distortion.
The U.S. stock market does not merely support the U.S. economy.
It changes the price of everyone else’s economy.
Foreign investors are pulled into the same trap.
If they avoid U.S. equities because the valuations look absurd, they risk underperforming the global benchmark.
If they buy U.S. equities, they help push U.S. valuations higher.
If U.S. valuations rise higher, U.S. companies gain even more acquisition power.
The loop reinforces itself.
global capital flows into U.S. equities
→ U.S. multiples expand
→ U.S. firms gain purchasing power
→ foreign assets look cheaper
→ more capital chases U.S. growth
→ foreign markets fall further behind
This is why the issue is not only financial.
It becomes strategic.
If Europe wants strategic autonomy, but its companies trade at a deep discount to U.S. peers, then autonomy becomes harder to maintain.
If Canada, Britain, Japan, Germany, Ireland, France, or the rest of Europe produces valuable companies but cannot value them at U.S. multiples, those companies become vulnerable.
The danger is not that the U.S. literally buys entire countries.
That is not how this works.
The danger is quieter.
The U.S. asset-price machine can buy the strategic pieces.
The platform.
The chip firm.
The robotics company.
The energy site.
The AI lab.
The defence supplier.
The data-centre location.
The satellite technology.
The software layer.
The foreign economy remains formally independent, but its future bottlenecks are increasingly priced, financed, acquired, or dominated through the U.S. market.
That is why valuation matters.
Valuation is not just a number on a screen.
Valuation determines who can buy whom.
It determines who can raise capital.
It determines who can absorb losses.
It determines who can fund infrastructure.
It determines who can hire talent.
It determines who can survive a downturn.
It determines who becomes the acquirer and who becomes the target.
This is the global consequence of the Asset-Price State.
Inside the United States, asset inflation supports federal revenue.
Outside the United States, asset inflation turns U.S. companies into acquisition machines.
That is why the rest of the world cannot simply ignore U.S. valuations.
Even if foreign policymakers think the numbers are insane, they still have to respond to them.
They have to protect strategic firms.
They have to subsidise national champions.
They have to restrict foreign takeovers.
They have to build domestic capital markets.
They have to explain why their companies are being valued at a fraction of U.S. equivalents.
They have to compete with the gravitational pull of the U.S. index.
That is the repricing.
The U.S. does not only export inflation through the dollar.
It does not only export valuation pressure through the stock market.
It forces the rest of the world to measure itself against a market that no longer behaves like a normal market.
And if the U.S. market is being inflated partly because the U.S. fiscal system needs the asset base to expand, then everyone else is being pulled into America’s fiscal solution.
That is the uncomfortable conclusion.
The U.S. stock market does not merely reflect American power.
It manufactures it.
And once it manufactures enough of it, everyone else gets repriced.
18. Why the U.S. needs low rates and high stocks
This is the final shape of the system.
The United States does not simply need growth.
It needs a very specific combination of conditions to hold at the same time.
low-enough rates
high-enough stocks
manageable inflation
strong nominal GDP
AI valuation expansion
global dollar demand
continued foreign participation
That is the survival corridor.
Low rates reduce the interest burden.
High stocks support the Asset-Tax Amplifier.
Inflation reduces the real value of old debt.
Nominal GDP growth lifts nominal tax receipts.
AI justifies extreme valuations.
National champions absorb global capital.
Dollar dominance keeps the rest of the world inside the system.
Foreign investors help fund the machine.
Each piece supports the others.
low rates
→ lower debt-service pressure
→ higher equity valuations
→ stronger asset-linked tax receipts
→ more fiscal breathing room
And:
controlled inflation
→ higher nominal GDP
→ higher nominal revenue
→ lower real debt burden
→ easier debt service
And:
AI narrative
→ mega-cap valuation expansion
→ index strength
→ capital gains and stock compensation
→ federal revenue support
And:
dollar dominance
→ foreign capital flows into U.S. assets
→ U.S. valuations rise
→ U.S. companies gain acquisition power
→ global assets are repriced around the U.S. market
That is the machine.
The mistake is to think the U.S. wants low inflation above everything else.
It does not.
Low inflation is useful only if it does not break the debt machine.
The mistake is to think the U.S. wants high rates because high rates prove monetary discipline.
It does not.
High rates are useful only until they start consuming the revenue base.
The mistake is to think the stock market is just a private casino.
It is not.
The stock market has become part of the public fiscal architecture.
That is why the real policy target is not simple price stability.
The real target is balance.
inflation high enough to dilute debt
but not high enough to destroy trust

rates low enough to protect debt service
but not low enough to trigger bond panic

stocks high enough to support revenue
but not so obviously inflated that belief collapses

AI real enough to justify valuations
but not so slow that the story breaks

dollar strong enough to preserve global demand
but weak enough in real terms to ease the debt burden
This is not a normal economic model.
It is a constraint-management system.
Every lever breaks something.
Raise rates too far, and debt service explodes.
Cut rates too aggressively, and inflation credibility weakens.
Let stocks fall, and the tax amplifier runs in reverse.
Push stocks too high, and valuation credibility breaks.
Allow inflation to run, and voters suffer.
Crush inflation, and the asset machine weakens.
That is the box.
And once the system is inside that box, the stock market becomes more than a market.
It becomes the pressure valve.
It is where inflation, debt, revenue, AI, foreign capital, national power, and political legitimacy meet.
That is why policymakers cannot treat it casually.
A deep market fall is not just a correction.
It is a hit to confidence.
A hit to capital gains.
A hit to stock compensation.
A hit to taxable high-end income.
A hit to federal revenue.
A hit to the debt-service machine.
That is why the market keeps getting protected.
Not because the system is kind.
Not because investors deserve rescue.
Not because valuations are always rational.
Because the state has become dependent on the asset base.
This is the Asset-Price State.
The U.S. survival strategy is not low inflation.
It is controlled inflation plus high asset prices.
It is not austerity.
It is not default.
It is not honest deleveraging.
It is managed dilution through nominal growth, asset inflation, and global capital absorption.
The public sees a stock market.
The Treasury sees revenue.
The Fed sees financial conditions.
The White House sees legitimacy.
Mega-cap companies see acquisition power.
Foreign investors see the only market large enough to absorb their capital.
The system sees collateral.
That is the point.
The higher the interest burden rises, the more the system needs the market to remain believable.
The more the market must remain believable, the more it needs AI, national champions, and frontier assets to justify extreme valuations.
The more those valuations expand, the more the U.S. can support its revenue system and project power globally.
This is why the stock market keeps going up.
Not in a straight line.
Not without crashes.
Not because every price is rational.
But because the entire system is now biased toward keeping the asset base expanding.
The machine does not need perfection.
It needs belief.
It needs enough belief to keep capital flowing.
Enough belief to keep valuations high.
Enough belief to keep tax receipts strong.
Enough belief to keep debt service manageable.
Enough belief to keep the future priced large enough to pay for the present.
That is the real target.
Not 2% inflation.
Not a balanced budget.
Not normal valuation.
The target is continuity.
And the mechanism is asset inflation.
19. The exits: the Asset-Price State
So how does a system like this escape?
If the stock market has become part of the fiscal machinery of the state, then the exit has to answer one question:
What replaces the stock market as the stabiliser?
Because asset inflation is not doing one job.
It is doing several.
It supports confidence.
It supports collateral.
It supports retirement wealth.
It supports capital gains.
It supports stock compensation.
It supports federal tax receipts.
It supports the story that the system is still growing.
So escaping the Asset-Price State means replacing the work asset prices are currently doing.
There are only four broad paths.
| Exit | What it requires | Problem |
|---|---|---|
| Productivity escape | AI becomes real productivity fast enough | Productivity transitions take time |
| Tax restructuring | Revenue becomes less dependent on asset-sensitive income | Politically brutal |
| Financial repression | Rates stay below inflation and debt is diluted slowly | Savers and bondholders pay |
| Muddle-through | Nominal assets, debt, GDP, and tax receipts all rise together | Purchasing power erodes |
The cleanest exit is real productivity.
AI works, not as a stock-market story, but as actual output. Software gets cheaper. Administration gets cheaper. Health care becomes more efficient. Energy systems become better managed. Scientific discovery accelerates. Robotics lowers physical production costs. Companies produce more with fewer inputs.
If that happens, the fiscal machine gets a real escape route.
AI productivity
→ real GDP growth
→ real earnings growth
→ stronger tax receipts
→ debt burden becomes more manageable
That is the optimistic path.
The valuations become justified because earnings arrive.
The debt becomes easier to carry because real output rises.
Inflation becomes less necessary because productivity supplies the growth.
But the timing is the problem.
Electricity took decades.
Computers took decades.
The internet took decades.
AI may be transformative, but the fiscal system may need relief faster than broad productivity can arrive.
The AI bet only works if the technology becomes real economic productivity before the valuation story breaks.
The second clean exit is political restructuring.
If the problem is that federal revenue is too dependent on asset-sensitive income, then the honest fix is to change the tax base and spending commitments.
Less dependence on volatile capital gains.
More dependence on broader, steadier, harder-to-avoid sources of revenue.
But that is the political third rail.
Consumption taxes are painful unless heavily redesigned.
Land and property taxes threaten entrenched wealth.
Mark-to-market wealth taxes are administratively complex and politically explosive.
Financial-transaction taxes hit markets directly.
Inheritance reform attacks dynastic capital.
And the people most affected usually have the most political power, legal resources, mobility, and influence.
So the technically honest fix becomes politically unlikely.
That leaves the less honest paths.
Financial repression is the silent-default route.
The state keeps rates below where the market would naturally set them. It pressures institutions to hold government debt. It allows inflation to run above yields. The debt is paid back in cheaper dollars.
Nobody announces a default.
Nobody says the debt is being restructured.
But savers lose purchasing power.
Bondholders earn negative real returns.
The currency is diluted slowly.
inflation above yields
→ negative real rates
→ debt burden erodes
→ savers absorb the loss
This is why financial repression is attractive to overindebted states.
It spreads the pain.
It hides the mechanism.
It turns debt reduction into an environment instead of an event.
But it also distorts capital allocation, punishes savers, weakens pensions, and pushes people toward hard assets, equities, property, gold, foreign assets, and anything else that seems less vulnerable to dilution.
Ironically, financial repression can push the system even deeper into asset inflation.
That leaves the most likely path.
Muddle-through.
The system does not solve the problem.
It manages it.
Rates stay lower than they otherwise would.
Inflation is tolerated but renamed.
Asset prices rise.
Nominal GDP rises.
Tax receipts rise.
Debt rises too.
The stock market rises faster.
The currency loses purchasing power.
The public feels poorer even while the indexes hit new highs.
nominal debt rises
→ nominal asset prices rise
→ nominal tax receipts rise
→ purchasing power falls
→ system survives
This is not a clean exit.
It is managed dilution.
The state does not default.
The market does not collapse.
The currency does not visibly fail.
But ordinary purchasing power is permanently degraded.
The public sees inflation.
The market sees nominal growth.
The Treasury sees revenue.
The Fed sees stability.
Politicians see a rising stock market.
Companies see valuations.
Investors see returns.
Everyone can point to a number that says the system is still working.
But underneath, the unit of account is being diluted.
That is why muddle-through is so powerful.
It asks the least of the political system.
It does not require explicit default.
It does not require honest austerity.
It does not require major tax restructuring.
It does not require immediate productivity miracles.
It only requires the system to keep doing what it already knows how to do:
protect asset prices
tolerate inflation
manage the narrative
roll the debt
wait for productivity
That is why the Asset-Price State is so difficult to escape.
The path that looks easiest is not really an exit.
It is the continuation of the regime.
And that brings us to the final definition.
The Asset-Price State is a system where private asset prices perform public fiscal work.
Nobody designed it in a single room.
There was no master plan.
No official doctrine.
No law declaring the stock market part of the fiscal system.
But the dependencies are now live.
The stock market is no longer just a market.
It is:
a tax engine
a confidence engine
a retirement system
a collateral base
a political scoreboard
a national-security funding layer
an AI infrastructure story
a global acquisition mechanism
a currency defence mechanism
In the old model, the stock market reflected the economy.
In the new model, the stock market helps hold the economy together.
That does not mean the stock market is the whole economy.
It is not.
It does not represent ordinary life.
It does not represent median wages.
It does not represent housing affordability.
But structurally, it has become load-bearing.
And once a market becomes load-bearing, policy changes around it.
Large drawdowns become harder to tolerate.
Liquidity arrives faster.
Rate pressure becomes political.
Inflation gets reinterpreted.
AI becomes a valuation story.
National champions become trillion-dollar containers.
Foreign capital gets pulled into the U.S. index.
The dollar remains dominant, but purchasing power is diluted through assets.
The system does not need to announce any of this.
It only has to respond to pressure.
And the pressure keeps pointing in the same direction:
protect the asset base
preserve market confidence
keep rates manageable
tolerate enough inflation
justify valuations with AI
absorb global capital
keep the revenue machine alive
That is the machine.
The debt grows.
Interest costs rise.
Revenue becomes constrained.
The stock market is asked to do more.
AI supplies the growth story.
National champions supply the valuation containers.
Foreign capital supplies the demand.
Inflation supplies the dilution.
And the tax system converts part of the asset inflation into public revenue.
The danger is not that this fails tomorrow.
The danger is that it works.
It can work for a long time.
It can produce rising indexes.
It can produce higher nominal GDP.
It can produce stronger nominal tax receipts.
It can produce trillion-dollar companies.
It can produce global acquisition power.
It can preserve the appearance of American strength.
But it can also hollow out purchasing power, concentrate wealth, punish savers, distort capital allocation, and make the state increasingly dependent on asset inflation.
That is the uncomfortable conclusion.
The system does not need everyone to get richer.
It needs the asset base to keep expanding.
It does not need ordinary people to feel prosperous.
It needs nominal values to keep rising.
It does not need a balanced budget.
It needs revenue to rise enough to keep the debt-service machine alive.
It does not need AI to transform life immediately.
It needs AI to keep the future priced large enough to support the present.
This is why the stock market keeps going up.
Not every day.
Not in a straight line.
Not because every valuation is rational.
Not because crashes are impossible.
But because the entire system is now biased toward protecting and expanding the asset base.
The stock market has become a load-bearing wall in the American state.
And once a market becomes a load-bearing wall, the word “market” no longer means what people think it means.
It means policy.
It means revenue.
It means collateral.
It means confidence.
It means currency defence.
It means national power.
It means survival.
That is the Asset-Price State.
Appendix 1: the $700bn asset-sensitive tax-base assumption
The model uses $700bn as the base-case estimate for the annual asset-sensitive tax base.
This is not a forecast.
It is not a claim that the stock market automatically produces $700bn of extra federal revenue every year.
It is a stress-test assumption.
The purpose is to ask a simpler question:
If rising asset prices need to close part of the federal revenue gap, how large would the asset-sensitive tax channel have to be?
The model then lets the reader test different assumptions.
The core formula is:
RequiredMarketMultiple =
    1 + RevenueGap / AssetSensitiveTaxBase
So if the asset-sensitive tax base is smaller, the required market expansion becomes larger.
If the asset-sensitive tax base is larger, the required market expansion becomes smaller.
That is why the assumption matters.
1. What the $700bn represents
In this model, AssetSensitiveTaxBase means the portion of federal receipts that could plausibly expand when asset prices rise.
That includes tax flows connected to:
realised capital gains
stock compensation
RSUs
options
bonuses
business equity
taxable investment income
high-end asset-linked income
The $700bn figure should be treated as a mid-range modelling assumption, not a precise accounting category.
There is no Treasury line item called “stock-market tax base.”
That is the point.
The stock market enters the revenue system indirectly, mainly through individual income tax, capital gains, stock-based compensation, business income, and high-income taxable flows.
A practical way to think about the assumption is:
IncrementalReceipts =
    IncrementalRealisedGains × EffectiveTaxTake
For example:
$3.5tn incremental realised gains × 20% effective tax take
= $700bn incremental receipts
That does not mean this exact outcome will occur.
It simply shows how a large enough asset-price cycle could generate a very large federal revenue effect.
2. Why this is plausible enough to stress-test
Capital-gains receipts are volatile.
They rise sharply in asset booms and fall sharply when markets weaken.
The Congressional Budget Office has noted that realised capital gains are difficult to project and can move significantly as a share of GDP during boom periods. The CBO’s capital-gains work is useful here because it shows the volatility and uncertainty of the tax channel rather than pretending the channel is stable.
Useful references:
Historical capital-gains data also show that realised gains and taxes paid on gains can swing dramatically from year to year.
Useful reference:
The distribution also matters.
Capital gains are highly concentrated among high-income households. That makes the revenue channel both powerful and unstable, because the same households are also most exposed to market valuations, business exits, stock compensation, and realisation timing.
Useful reference:
3. Sensitivity cases
The post uses three asset-sensitive tax-base scenarios.
| Scenario | AssetSensitiveTaxBase | Interpretation |
|---|---|---|
| Conservative | $350bn | Smaller realisations; market gains are not fully realised; tax behaviour limits receipts |
| Base case | $700bn | Mid-range stress assumption used in the main model |
| Optimistic | $1.4tn | Large realisations; broad profit-taking; unusually strong asset-linked taxable income |
These are not predictions.
They are stress-test inputs.
The purpose is to show how sensitive the Required Market Curve is to the size of the asset-linked revenue channel.
4. Worked examples
The formula is:
RequiredMarketMultiple =
    1 + RevenueGap / AssetSensitiveTaxBase
If the revenue gap is $700bn, then:
| AssetSensitiveTaxBase | RequiredMarketMultiple | Interpretation |
|---|---|---|
| $350bn | 3.0x | Small tax base requires extreme asset expansion |
| $700bn | 2.0x | Base case: asset-linked receipts must double |
| $1.4tn | 1.5x | Large tax base reduces required market expansion |
The relationship is simple.
The smaller the asset-sensitive tax base, the more the market has to rise to close the same fiscal gap.
The larger the asset-sensitive tax base, the less extreme the required market expansion becomes.
5. Effective tax-rate sensitivity
Another way to test the assumption is to vary the effective tax take on incremental realised gains.
| Incremental realised gains | 15% effective tax take | 20% effective tax take | 25% effective tax take |
|---|---|---|---|
| $2.0tn | $300bn | $400bn | $500bn |
| $3.5tn | $525bn | $700bn | $875bn |
| $5.0tn | $750bn | $1.0tn | $1.25tn |
| $7.0tn | $1.05tn | $1.4tn | $1.75tn |
This shows why the $700bn base case is not an extreme assumption.
It can be reached by combining:
large but plausible incremental realised gains
×
a mid-range effective tax take
But the uncertainty is large.
Realisation behaviour matters.
Tax rates matter.
Timing matters.
Market psychology matters.
Policy changes matter.
That is why the post treats $700bn as a modelling assumption rather than a fixed fact.
6. Caveats
The asset-sensitive tax channel is not mechanical.
A rising market does not automatically produce proportional federal revenue.
Several factors can weaken or delay the effect:
investors may defer realisations
loss harvesting may offset gains
tax rates may change
founders may borrow against shares instead of selling
stock compensation may vest at different times
private-company valuations may not translate into taxable events
market gains may be concentrated in unrealised wealth
There is also realisation elasticity: when tax rates, market conditions, or expectations change, taxpayers may change when and how they realise gains.
Recent academic work on capital-gains realisation behaviour is useful for understanding this timing uncertainty:
For that reason, the $700bn number should be read as:
a transparent stress-test input, not a precise fiscal forecast.
The model is strongest when readers recompute the Required Market Curve under multiple assumptions.
Recommended sensitivity cases:
AssetSensitiveTaxBase = $350bn
AssetSensitiveTaxBase = $700bn
AssetSensitiveTaxBase = $1.4tn

EffectiveTaxTake = 15%
EffectiveTaxTake = 20%
EffectiveTaxTake = 25%
If the argument only works under one assumption, it is fragile.
If the same structural pressure appears across several assumptions, the model is more useful.
That is why the appendix includes sensitivity cases.
Appendix 2: When the curve breaks
This is the code used for section 11
import pandas as pd

starting_debt = 31.6e12          # debt held by the public
starting_revenue = 5.6e12        # approximate federal revenue
starting_interest = 1.0e12       # approximate current net interest

debt_growth_rate = 0.058         # approximate debt growth assumption
revenue_growth_rate = 0.04       # assume 4% nominal revenue growth from inflation
asset_sensitive_tax_base = 700e9 # modelling assumption

current_interest_revenue_ratio = starting_interest / starting_revenue

rates = [0.04, 0.05, 0.075, 0.10, 0.12]
horizons = [1, 5, 10]

rows = []

for years in horizons:
    debt = starting_debt * ((1 + debt_growth_rate) ** years)
    revenue = starting_revenue * ((1 + revenue_growth_rate) ** years)
    target_interest = revenue * current_interest_revenue_ratio

    for rate in rates:
        interest = debt * rate
        revenue_gap = max(0, interest - target_interest)
        required_market_multiple = 1 + (revenue_gap / asset_sensitive_tax_base)

        rows.append({
            "years": years,
            "effective_rate": f"{rate:.1%}",
            "debt_trn": debt / 1e12,
            "revenue_trn": revenue / 1e12,
            "interest_trn": interest / 1e12,
            "interest_revenue_share": interest / revenue,
            "revenue_gap_trn": revenue_gap / 1e12,
            "required_market_multiple": required_market_multiple,
        })

df = pd.DataFrame(rows)

print(df.round({
    "debt_trn": 2,
    "revenue_trn": 2,
    "interest_trn": 2,
    "interest_revenue_share": 2,
    "revenue_gap_trn": 2,
    "required_market_multiple": 2,
}))
Appendix 3: The reverse Case
Code for section 12.
import pandas as pd

starting_debt = 31.6e12
starting_revenue = 5.6e12
debt_growth_rate = 0.058
revenue_growth_rate = 0.04

asset_sensitive_tax_base = 700e9

rates = [0.05, 0.075, 0.10, 0.12]

market_paths = {
    "-10%, then -10%": [-0.10, -0.10],
    "-20%, then flat": [-0.20, 0.00],
    "-20%, then -20%": [-0.20, -0.20],
}

# One-year baseline
debt = starting_debt * (1 + debt_growth_rate)
revenue_before_shock = starting_revenue * (1 + revenue_growth_rate)

rows = []

for name, quarterly_returns in market_paths.items():
    market_level = 1.0

    for r in quarterly_returns:
        market_level *= (1 + r)

    cumulative_drawdown = 1 - market_level

    for tax_elasticity in [1.0, 2.0]:
        revenue_loss = min(
            asset_sensitive_tax_base,
            asset_sensitive_tax_base * cumulative_drawdown * tax_elasticity
        )

        revenue_after_shock = revenue_before_shock - revenue_loss

        for rate in rates:
            interest = debt * rate
            interest_revenue_ratio = interest / revenue_after_shock

            rows.append({
                "scenario": name,
                "cumulative_drawdown": cumulative_drawdown,
                "tax_elasticity": tax_elasticity,
                "revenue_loss_bn": revenue_loss / 1e9,
                "revenue_after_shock_trn": revenue_after_shock / 1e12,
                "effective_rate": rate,
                "interest_trn": interest / 1e12,
                "interest_revenue_ratio": interest_revenue_ratio,
            })

df = pd.DataFrame(rows)

print(df.round({
    "cumulative_drawdown": 3,
    "revenue_loss_bn": 0,
    "revenue_after_shock_trn": 2,
    "effective_rate": 3,
    "interest_trn": 2,
    "interest_revenue_ratio": 2,
}))
Appendix 4: Market Curve code
import matplotlib.pyplot as plt
import pandas as pd

# -----------------------------
# Core assumptions
# -----------------------------
starting_revenue = 5.6e12
starting_interest = 1.0e12
revenue_growth_rate = 0.04
debt_growth_rate = 0.058
asset_sensitive_tax_base = 700e9

debt_public = 31.6e12
debt_gross = 39.2e12

rates = [0.05, 0.075, 0.10]
years = list(range(0, 11))

current_interest_revenue_ratio = starting_interest / starting_revenue

# -----------------------------
# Helper function
# -----------------------------
def required_market_multiple(starting_debt, rate, year):
    debt = starting_debt * ((1 + debt_growth_rate) ** year)
    revenue = starting_revenue * ((1 + revenue_growth_rate) ** year)
    target_interest = revenue * current_interest_revenue_ratio
    interest = debt * rate
    revenue_gap = max(0, interest - target_interest)
    multiple = 1 + (revenue_gap / asset_sensitive_tax_base)
    return multiple

# -----------------------------
# Build table
# -----------------------------
rows = []

for debt_label, starting_debt in [
    ("Debt held by the public", debt_public),
    ("Gross federal debt", debt_gross),
]:
    for rate in rates:
        for year in years:
            rows.append({
                "Debt Base": debt_label,
                "Rate": f"{rate*100:.1f}%",
                "Year": year,
                "Required Market Multiple": required_market_multiple(starting_debt, rate, year),
            })

df = pd.DataFrame(rows)

# -----------------------------
# Plot
# -----------------------------
plt.figure(figsize=(12, 7))

for rate in rates:
    subset_public = df[
        (df["Debt Base"] == "Debt held by the public") &
        (df["Rate"] == f"{rate*100:.1f}%")
    ]
    plt.plot(
        subset_public["Year"],
        subset_public["Required Market Multiple"],
        label=f"Public debt @ {rate*100:.1f}%"
    )

for rate in rates:
    subset_gross = df[
        (df["Debt Base"] == "Gross federal debt") &
        (df["Rate"] == f"{rate*100:.1f}%")
    ]
    plt.plot(
        subset_gross["Year"],
        subset_gross["Required Market Multiple"],
        linestyle="--",
        label=f"Gross debt @ {rate*100:.1f}%"
    )

plt.title("Required Market Curve")
plt.xlabel("Years")
plt.ylabel("Required Market Multiple")
plt.legend()
plt.grid(True)
plt.tight_layout()
plt.show()

# -----------------------------
# Summary checkpoints
# -----------------------------
checkpoints = df[df["Year"].isin([1, 5, 10])].copy()
pivot = checkpoints.pivot_table(
    index="Year",
    columns=["Debt Base", "Rate"],
    values="Required Market Multiple"
)

print(pivot.round(2))
Appendix 5: Reverse Stress Model
import pandas as pd
import matplotlib.pyplot as plt

# -----------------------------
# Core assumptions
# -----------------------------
starting_revenue = 5.6e12
revenue_growth_rate = 0.04
debt_growth_rate = 0.058

debt_public = 31.6e12
debt_gross = 39.2e12

asset_sensitive_tax_base = 700e9

rates = [0.05, 0.075, 0.10, 0.12]

market_paths = {
    "-10%, then -10%": [-0.10, -0.10],
    "-20%, then flat": [-0.20, 0.00],
    "-20%, then -20%": [-0.20, -0.20],
}

# One-year baseline after normal growth
revenue_before_shock = starting_revenue * (1 + revenue_growth_rate)
public_debt_after_growth = debt_public * (1 + debt_growth_rate)
gross_debt_after_growth = debt_gross * (1 + debt_growth_rate)

rows = []

for scenario, returns in market_paths.items():
    market_level = 1.0

    for r in returns:
        market_level *= (1 + r)

    cumulative_drawdown = 1 - market_level

    for tax_case, tax_elasticity in [
        ("Linear: 1x market fall", 1.0),
        ("Stress: 2x market fall", 2.0),
    ]:
        revenue_loss = min(
            asset_sensitive_tax_base,
            asset_sensitive_tax_base * cumulative_drawdown * tax_elasticity
        )

        revenue_after_shock = revenue_before_shock - revenue_loss

        for debt_base, debt_value in [
            ("Debt held by the public", public_debt_after_growth),
            ("Gross federal debt", gross_debt_after_growth),
        ]:
            for rate in rates:
                interest = debt_value * rate
                interest_revenue_ratio = interest / revenue_after_shock

                rows.append({
                    "Scenario": scenario,
                    "Cumulative Drawdown": cumulative_drawdown,
                    "Tax Case": tax_case,
                    "Revenue Loss ($B)": revenue_loss / 1e9,
                    "Revenue After Shock ($T)": revenue_after_shock / 1e12,
                    "Debt Base": debt_base,
                    "Effective Rate": f"{rate*100:.1f}%",
                    "Interest ($T)": interest / 1e12,
                    "Interest / Revenue": interest_revenue_ratio,
                })

df = pd.DataFrame(rows)

# -----------------------------
# Table 1: Revenue loss
# -----------------------------
loss_table = (
    df[["Scenario", "Tax Case", "Revenue Loss ($B)"]]
    .drop_duplicates()
    .pivot(index="Scenario", columns="Tax Case", values="Revenue Loss ($B)")
)

print("Revenue loss table")
print(loss_table.round(0))

# -----------------------------
# Table 2: Stress case, public debt
# -----------------------------
public_stress = df[
    (df["Tax Case"] == "Stress: 2x market fall") &
    (df["Debt Base"] == "Debt held by the public")
]

public_ratio_table = public_stress.pivot(
    index="Scenario",
    columns="Effective Rate",
    values="Interest / Revenue"
)

print("\nInterest / revenue ratio — public debt")
print((public_ratio_table * 100).round(1))

# -----------------------------
# Table 3: Stress case, gross debt
# -----------------------------
gross_stress = df[
    (df["Tax Case"] == "Stress: 2x market fall") &
    (df["Debt Base"] == "Gross federal debt")
]

gross_ratio_table = gross_stress.pivot(
    index="Scenario",
    columns="Effective Rate",
    values="Interest / Revenue"
)

print("\nInterest / revenue ratio — gross debt")
print((gross_ratio_table * 100).round(1))

# -----------------------------
# Chart 1: Revenue loss by shock
# -----------------------------
loss_table.plot(kind="bar", figsize=(10, 6))
plt.title("Asset-Sensitive Revenue Loss from Stock-Market Shock")
plt.xlabel("Market Shock")
plt.ylabel("Revenue Loss ($B)")
plt.xticks(rotation=30, ha="right")
plt.tight_layout()
plt.show()

# -----------------------------
# Chart 2: Interest/revenue ratio after shock
# Main fair model: debt held by the public
# -----------------------------
public_ratio_table.plot(kind="bar", figsize=(10, 6))
plt.title("Interest / Revenue Ratio After Market Shock\nDebt Held by the Public")
plt.xlabel("Market Shock")
plt.ylabel("Interest / Revenue")
plt.xticks(rotation=30, ha="right")
plt.tight_layout()
plt.show()

# -----------------------------
# Chart 3: Gross-debt stress version
# -----------------------------
gross_ratio_table.plot(kind="bar", figsize=(10, 6))
plt.title("Interest / Revenue Ratio After Market Shock\nGross Federal Debt Stress Version")
plt.xlabel("Market Shock")
plt.ylabel("Interest / Revenue")
plt.xticks(rotation=30, ha="right")
plt.tight_layout()
plt.show()
Sources
Section 1
| Ref | Use it to support | Source |
|---|---|---|
| 1 | “More than half of federal revenue comes from individual income taxes.” | CBO says FY2025 federal revenue was $5.2T, with more than half from individual income taxes. (cbo.gov) |
| 2 | “The tax burden is concentrated at the top.” | CBO’s income distribution report shows the top income quintile paid 70% of federal taxes in 2022, and the top 1% paid 27%. |
| 3 | “Stock ownership is concentrated at the top.” | Fed/FRED Distributional Financial Accounts show the top 1% held 50.2% of corporate equities and mutual fund shares in Q4 2025, while the 90th–99th percentiles held another 37.2%. Together, the top 10% held 87.4%. (FRED) |
| 4 | “Capital-gains tax receipts are asset-price sensitive and volatile.” | CBO says capital-gains realizations are influenced by asset values, and that capital-gains receipts exceeded 14% of individual income-tax revenue in FY2021 and FY2022. (cbo.gov) |
| 5 | “Interest costs are becoming the pressure point.” | CBO projects net interest rising from $970B in 2025 to over $1T in 2026; CRFB’s summary of CBO projects interest reaching $2.1T by 2036. (cbo.gov) |
| [6] | “The stock market feeds household wealth and consumption confidence.” | Fed Z.1 shows household net worth movements are directly affected by corporate equity gains/losses; Reuters reported the wealthiest 10% account for nearly half of U.S. consumer spending. (Federal Reserve) |
[S1] CBO baseline spending/revenue curve CBO projects federal outlays of $7.4T in 2026, rising to $11.4T in 2036, while revenue rises from $5.6T to $8.3T; deficits rise from $1.9T to $3.1T. (Congressional Budget Office)
[S2] Interest is the fastest-growing budget pressure CRFB’s summary of CBO says net interest is projected to more than double from $970B in FY2025 to $2.1T by FY2036, and that interest will consume about one-quarter of all revenue by 2036. (CRFB)
[S3] Revenue concentration Adam Michel’s article states that personal income taxes raise just over half of federal revenue, payroll taxes account for about 33%, and the top 10% pay 72% of income taxes. (adamnmichel.substack.com)
The section’s core sentence
This is the sentence I’d make bold in the post:
The stock market does not simply need to stay high. It needs to grow into the gap.
That gets exactly what you’re saying. The U.S. spending curve keeps rising; the interest curve keeps rising faster; ordinary revenue cannot keep up; therefore the asset-price contribution has to expand.
Section 6
CBO’s 2026–2036 outlook supports the spending/debt pressure: deficits rise from $1.9T in 2026 to $3.1T by 2036, and rising net interest costs drive much of that increase. (Congressional Budget Office) CRFB’s CBO summary says spending rises from $7.0T in 2025 to $11.4T by 2036, while revenue rises from $5.2T to $8.3T, so spending continues to grow faster than revenue. (CRFB)
For the market-concentration part, the S&P 500 is a market-cap-weighted index covering around 80% of available U.S. market capitalization, so mega-cap concentration mechanically matters to the “market” politicians and investors cite. (S&P Global) The Magnificent Seven were about 34.8% of the S&P 500 as of May 2026, according to Motley Fool’s S&P 500/Mag 7 data summary, while D.E. Shaw analysis cited by MarketWatch put the top 10 at 40.7% of the index as of December and said the rest of the index would need to rise over 160% to restore pre-2020 diversification if the top 10 stayed flat. (The Motley Fool)
For the AI-growth-story plate, Goldman Sachs said AI investment was expected to drive roughly 40% of S&P 500 earnings growth in 2026, with the largest cloud-computing companies planning about $670B of spending. (Goldman Sachs) Reuters reported Goldman later expected AI infrastructure companies to contribute about half of 2026 EPS gains, while semiconductors central to AI infrastructure had recently seen prices rise faster than earnings. (Reuters)