Debugging Jupyter Notebooks in VS Code
Summary
Visual Studio Code is the most popular editor for development.
Jupyter Notebooks is the most widely used way to share, demonstrate and develop code in modern AI development.
Debugging code is not just used when you have a bug. After you have written any substantial piece of code I suggest stepping through it in the debugger if possible. This can help improve you understanding and the quality of the code you have written
This post will show you how to debug python code in Jupyter notebooks using VScode.
1. Setting Up Jupyter Notebook Debugging in VS Code
1.1 Install Required Extensions
To debug Jupyter notebooks in VS Code, you’ll need these extensions:
- Python Extension: Essential for Python development. Provides rich language support, including IntelliSense, code navigation, and refactoring.
- Jupyter Extension: Enables Jupyter Notebook support within VS Code, allowing you to create, edit, and run notebooks seamlessly.
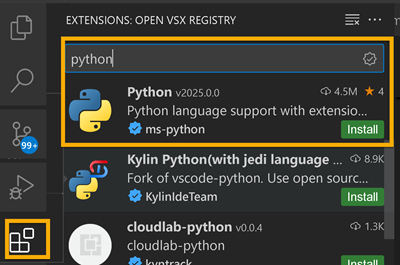
Install them by following these steps:
- Open VS Code.
- Go to Extensions (Ctrl + Shift + X / ⌘ + Shift + X on macOS).
- Search for Python and Jupyter, then install them.
If you see multiple extensions choose the ones with the largest number of installs.
1.2 Set Up a Virtual Environment (Recommended)
It’s a good practice to use a virtual environment to avoid dependency conflicts.
# Create a virtual environment
python -m venv venv

# Activate it (Windows)
venv\Scripts\activate

# Activate it (macOS/Linux)
source venv/bin/activate

# Install Jupyter
pip install jupyter
1.3 Select the Correct Kernel
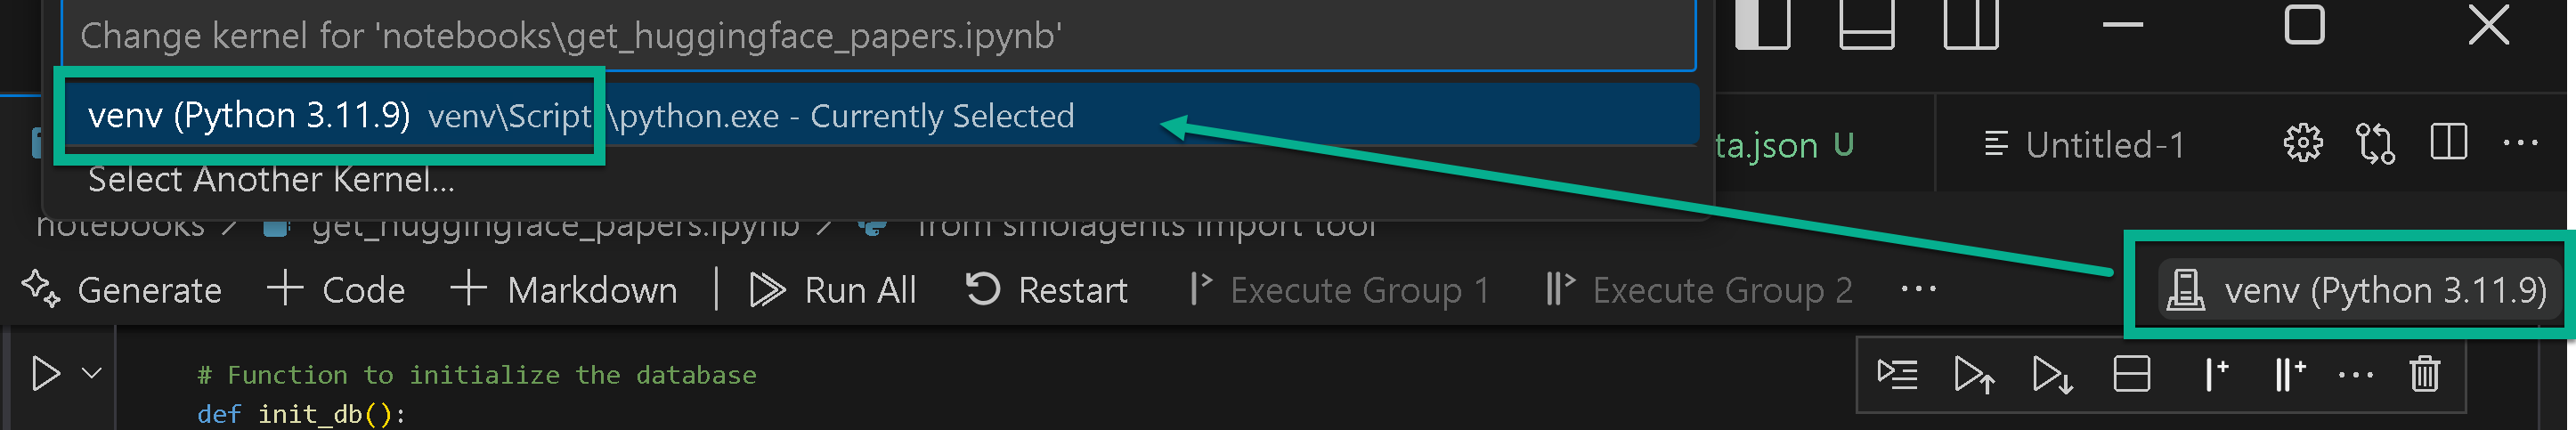
Before running or debugging a notebook:
- Open a Jupyter Notebook (.ipynb) in VS Code.
- Click the Kernel Selector (top-right).
- Select the correct Python environment.
2. Debugging Jupyter Notebooks in VS Code
Once the environment is set up you can start debugging!
2.1 Enabling Debugging Mode
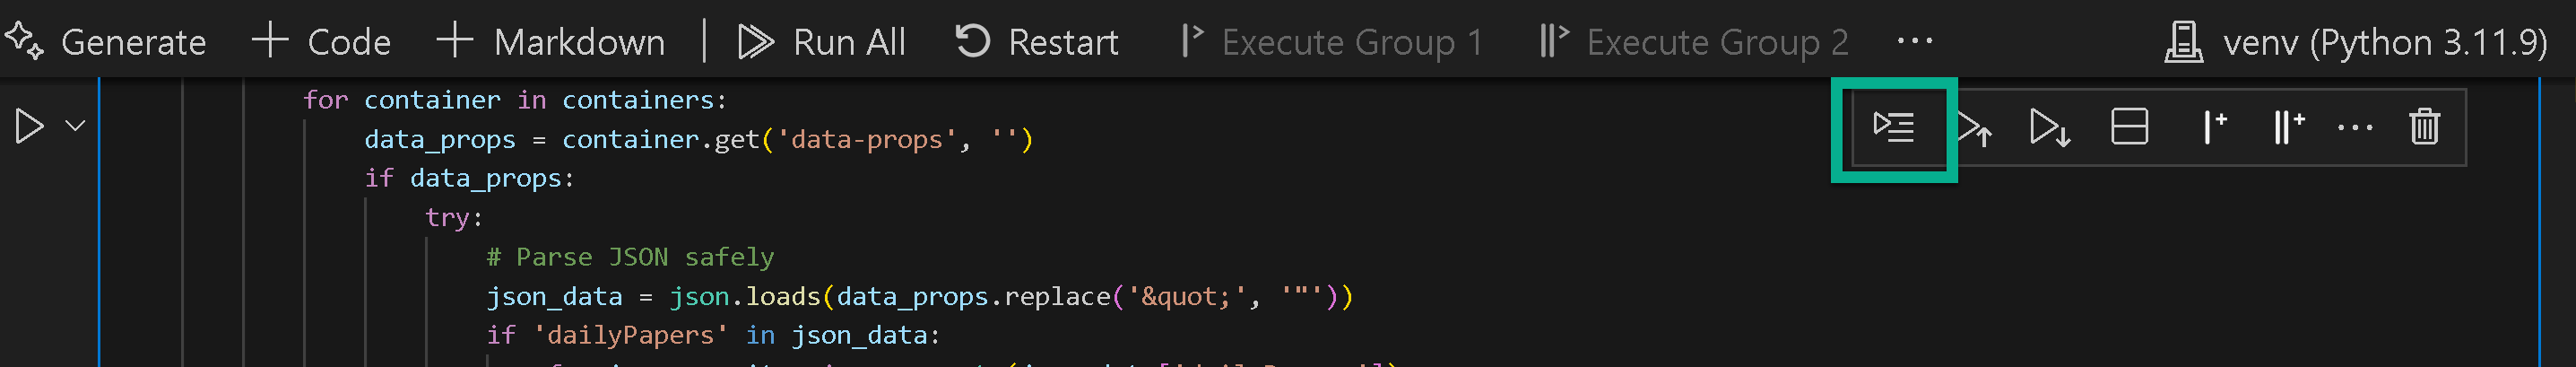
To enable debugging:
- Open your Jupyter notebook (
.ipynb). - Click the Debug Icon next to a code cell.
- The notebook will start in debug mode.
🔽 How to enable Jupyter debugging in VS Code
Alternatively, use this magic command inside a Jupyter cell:
%debug
This will activate interactive debugging when an error occurs. This is very useful for post-mortem debugging.
2.2 Setting Breakpoints in Jupyter Notebooks
You can set breakpoints to pause execution and inspect variables.
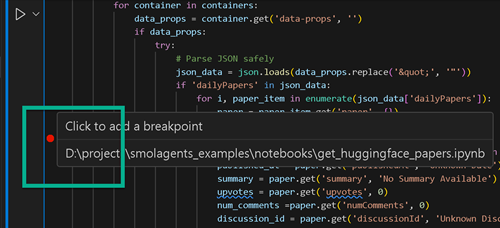
To set a breakpoint:
- Click in the left gutter (the area to the left of the line numbers) next to the line of code where you want to pause.
- A red dot will appear (indicating a breakpoint).
- Run the cell in debug mode.
🔽 GIF: Setting breakpoints in Jupyter notebooks
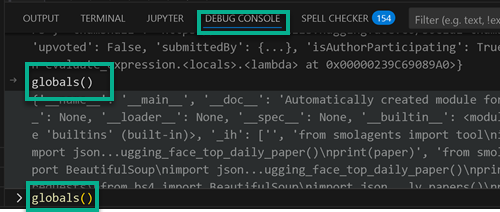
2.3 Using the Debug Console
While debugging, use the Debug Console to inspect variables.
- Open the “Debug Console” at the bottom.
- Type variable names to check their values.
- Use:
locals() # Show all local variables globals() # Show all global variables - Modify variables on the fly.
🔽 GIF: Using the Debug Console in VS Code
2.4 Step-by-Step Execution
VS Code provides step execution buttons for debugging:
- Step Over (F10) – Run the current line and go to the next.
- Step Into (F11) – Enter function calls for deep debugging.
- Step Out (Shift + F11) – Exit the current function.
3. Debugging Common Issues in Jupyter Notebooks
Here are solutions to common debugging issues.
3.1 Kernel Not Starting
✅ Ensure the correct Python environment is selected.
✅ Restart VS Code and the Jupyter kernel.
✅ If the issue persists, reinstall Jupyter:
pip install --upgrade jupyter
3.2 Breakpoints Not Working
✅ Make sure debugging is enabled.
✅ Use import pdb; pdb.set_trace() inside a cell:
def test_function():
    x = 10
    import pdb; pdb.set_trace()  # Triggers the debugger
    print(x)

test_function()
✅ Run the notebook in debug mode.
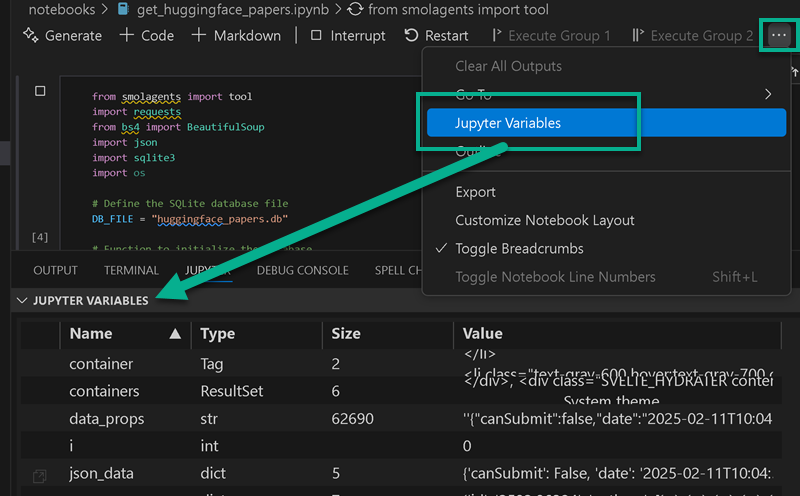
3.3 Debug Console Not Showing Variables
✅ Run the cell in debug mode first.
✅ Use locals() and globals() to check variables.
✅ Open the Variables Panel in VS Code.
🔽 GIF: Viewing variables in VS Code Debugger
4. Best Practices for Debugging Jupyter Notebooks
To make debugging more efficient, follow these best practices:
4.1 Use Logging Instead of Print Statements
Instead of using print(), use Python’s logging module. The logging module is more powerful and flexible than print(). :
import logging

logging.basicConfig(level=logging.DEBUG, format='%(asctime)s - %(levelname)s - %(message)s')  # Configure logging

x = 5
logging.debug(f"Value of x: {x}")  # Use logging.debug() for debug messages
logging.info("This is an informational message.")
logging.warning("This is a warning message.")
logging.error("This is an error message.")
logging.critical("This is a critical message.")
4.2 Modularize Your Code
Break down complex logic into smaller, reusable functions and place them in separate .py files. This makes your code easier to test, debug, and maintain.
Example:
# utils.py
def add(a, b):
    return a + b
Then import it in your notebook:
from utils import add
add(3, 5)
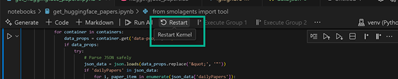
4.3 Restart Kernel Regularly
Jupyter kernels store variables between runs, which may cause errors.
Always restart the kernel to clear memory.
GIF: Restarting Jupyter Kernel
4.4 Use %debug for Quick Debugging
If an error occurs, simply type:
%debug
This opens an interactive debugger at the point of failure.
4.5 Use the pdb module directly for fine-grained control
For very complex debugging scenarios, you can use the pdb module directly. This gives you complete control over the debugging process.
import pdb

def my_function():
    x = 10
    pdb.set_trace() # Execution will pause here
    y = x * 2