K-Means Clustering
Summary
Imagine you have a dataset of customer profiles. How can you group similar customers together to tailor marketing campaigns? This is where K-Means clustering comes into play.
K-Means is a popular unsupervised learning algorithm used for clustering data points into distinct groups based on their similarities.
It is widely used in various domains such as customer segmentation, image compression, and anomaly detection.
In this blog post, we’ll cover how K-Means works and demonstrate its implementation in Python using scikit-learn.
Supervised vs. Unsupervised Learning
Supervised Learning in machine learning involves training a model on labeled data.
This is where the input data is accompanied by corresponding output labels.
The goal is to learn a mapping between inputs and outputs so the model can predict outcomes for new, unseen data.
Common examples include classification (e.g., identifying spam emails) and regression (e.g., predicting house prices).
In contrast, Unsupervised Learning deals with unlabeled data, aiming to discover hidden patterns or structures within the dataset without predefined outputs.
How K-Means Clustering Works
K-Means works by partitioning data into K clusters. The algorithm follows these steps:
- Initialize: Select
Kinitial cluster centroids randomly. - Assignment: Assign each data point to the closest centroid.
- Update: Compute new centroids by averaging the data points assigned to each cluster.
- Repeat: Repeat steps 2 and 3 until centroids no longer change significantly or a maximum number of iterations is reached.
Implementing K-Means in Python
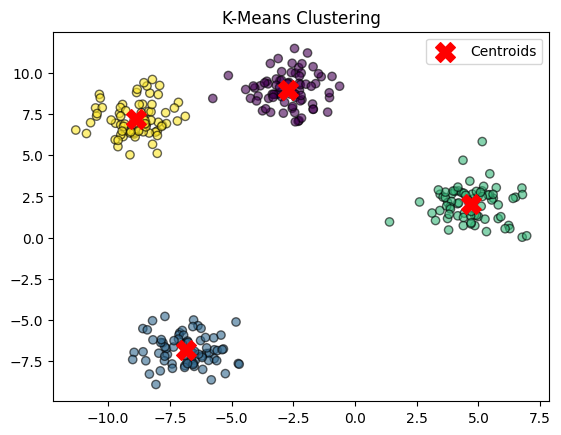
Let’s apply K-Means to a simple dataset and visualize the clusters.
import numpy as np
import matplotlib.pyplot as plt
from sklearn.cluster import KMeans
from sklearn.datasets import make_blobs

# Generate sample data
X, y = make_blobs(n_samples=300, centers=4, cluster_std=1.0, random_state=42)

# Apply K-Means with K=4
kmeans = KMeans(n_clusters=4, random_state=42)
kmeans.fit(X)
labels = kmeans.labels_
centroids = kmeans.cluster_centers_

# Plot the clusters
plt.scatter(X[:, 0], X[:, 1], c=labels, cmap='viridis', alpha=0.6, edgecolors='k')
plt.scatter(centroids[:, 0], centroids[:, 1], s=200, c='red', marker='X', label='Centroids')
plt.title('K-Means Clustering')
plt.legend()
plt.show()
Explanation of the Code:
- We generate synthetic data with four clusters using
make_blobs. - We initialize
KMeanswithn_clusters=4and fit it to the data. - The
labels_attribute stores the cluster assignments for each point. - We plot the clustered points with their centroids highlighted.
Choosing the Optimal Number of Clusters (K)
Determining the best K can be done using the Elbow Method:
wcss = []  # Within-cluster sum of squares
for i in range(1, 11):
    kmeans = KMeans(n_clusters=i, random_state=42)
    kmeans.fit(X)
    wcss.append(kmeans.inertia_)

plt.plot(range(1, 11), wcss, marker='o')
plt.xlabel('Number of Clusters')
plt.ylabel('WCSS')
plt.title('Elbow Method for Optimal K')
plt.show()
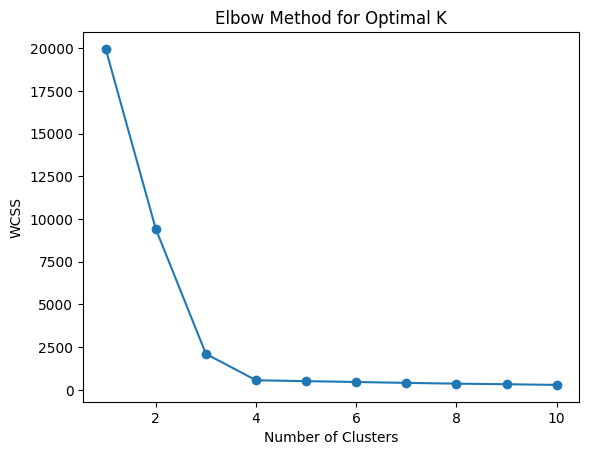
How the Elbow Method Works:
- We compute the Within-Cluster Sum of Squares (WCSS) for different values of
K. - The optimal K is the point where the WCSS curve bends like an “elbow”.
Benefits and Drawbacks of K-Means Clustering
K-Means is a widely used clustering algorithm due to its efficiency and simplicity, but it also has some limitations. Below are the key advantages and disadvantages.
Benefits of K-Means
1. Scalability and Efficiency
- K-Means is computationally efficient, especially for large datasets.
- The time complexity is O(n × k × i) (where
nis the number of points,kis the number of clusters, andiis the number of iterations). - It scales well with an increasing number of data points.
2. Easy to Implement
- K-Means is straightforward to understand and implement using libraries like
scikit-learn. - It requires only a few lines of code to apply clustering to a dataset.
3. Works Well for Well-Separated Clusters
- If data clusters are clearly distinct, K-Means provides accurate and meaningful results.
- It effectively partitions data into compact, spherical clusters.
4. Faster than Hierarchical Clustering
- Compared to hierarchical clustering, K-Means is significantly faster, making it a preferred choice for large datasets.
5. Can Handle High-Dimensional Data
- K-Means can work with high-dimensional datasets where other clustering methods may struggle.
Drawbacks of K-Means
1. Sensitive to the Choice of K
- The algorithm requires the number of clusters (
K) to be predefined. - Choosing the wrong
Kcan lead to poor clustering results. - The Elbow Method or Silhouette Score is often used to estimate the best
K.
2. Sensitive to Outliers and Noise
- Outliers can significantly impact centroids, leading to poor cluster assignments.
- It assumes all clusters are of equal size and density, which is not always the case.
3. Only Works Well for Spherical Clusters
- K-Means assumes clusters are spherical and equally sized.
- If clusters have irregular shapes or varying densities, K-Means may fail to properly segment them.
4. Random Initialization Can Affect Results
- The initial placement of centroids can influence the final clustering outcome.
- K-Means++ initialization is used to mitigate this issue.
5. Struggles with Non-Linear Boundaries
- If the underlying clusters have complex, non-linear shapes, K-Means fails because it relies on Euclidean distance.
Using K-Means
Guidelines when to use K-Means.
When to Use K-Means?
️ When the data is well-separated into distinct clusters.
️ When computational efficiency is a priority.
️ When you need a quick and simple clustering algorithm.
️ When working with large datasets.
When NOT to Use K-Means?
When clusters are non-spherical or have varying densities.
When the dataset contains a lot of noise and outliers.
When the optimal number of clusters is unknown and hard to determine.
Applications of K-Means
K-Means is widely used due to its efficiency and versatility.
1️⃣ Customer Segmentation (Marketing & Business Analytics)
- Companies use K-Means to segment customers based on purchasing behavior, demographics, or online activity.
- Helps in targeted marketing, personalized recommendations, and customer retention strategies.
- Example: Segmenting customers in an e-commerce platform based on their spending habits.
2️⃣ Image Segmentation and Compression
- K-Means is used for image segmentation, where pixels are clustered based on color or intensity.
- Reduces the number of colors in an image, making compression more efficient.
- Example: Reducing an image with thousands of colors to a limited set of dominant colors.
import cv2
import numpy as np
from sklearn.cluster import KMeans

image = cv2.imread("image.jpg")
image = cv2.cvtColor(image, cv2.COLOR_BGR2RGB)
image = image.reshape((-1, 3))

kmeans = KMeans(n_clusters=5, random_state=42).fit(image)
compressed_image = kmeans.cluster_centers_[kmeans.labels_].reshape((100, 100, 3))
3️⃣ Anomaly Detection (Fraud Detection & Cybersecurity)
- K-Means can detect unusual patterns in fraud detection, network security, and intrusion detection.
- Data points that do not fit into any cluster or belong to small clusters can be flagged as anomalies.
- Example: Identifying fraudulent transactions in banking by clustering normal transactions and flagging outliers.
4️⃣ Document Clustering (Natural Language Processing - NLP)
- K-Means is used to group text documents into topics based on similarity.
- Often used in news categorization, search engines, and content recommendation.
- Example: Grouping research papers into topics using TF-IDF and K-Means.
from sklearn.feature_extraction.text import TfidfVectorizer
from sklearn.cluster import KMeans

documents = ["AI is transforming business", "Deep learning in healthcare", "E-commerce trends", "Blockchain and finance"]
vectorizer = TfidfVectorizer()
X = vectorizer.fit_transform(documents)

kmeans = KMeans(n_clusters=2, random_state=42).fit(X)
print(kmeans.labels_)
5️⃣ Gene Expression Clustering (Bioinformatics & Healthcare)
- Used in genetics to group genes with similar expression patterns.
- Helps in identifying subtypes of diseases like cancer.
- Example: Clustering patient data based on gene expression to predict disease risk.
6️⃣ Recommender Systems (Personalized Recommendations)
- K-Means is used to cluster users based on their behavior (e.g., movie preferences, product purchases).
- Used in Netflix, Spotify, and Amazon for personalized content recommendations.
- Example: Clustering users by viewing history and recommending similar content.
7️⃣ Supply Chain Optimization (Logistics & Transportation)
- Helps in optimizing warehouse locations and delivery routes.
- Example: Clustering geographic locations to minimize delivery time.
8️⃣ Healthcare and Medical Diagnosis
- Used for patient segmentation based on symptoms, medical history, or imaging data.
- Example: Grouping patients with similar symptoms to suggest targeted treatments.
9️⃣ Social Network Analysis
- Identifies communities or groups in social networks based on interaction patterns.
- Example: Detecting influencer clusters on Twitter or LinkedIn.
🔟 Sports Analytics
- Clusters players based on performance metrics.
- Example: Categorizing basketball players into different playing styles.
K-Means in Vector Databases
How K-Means is Used in Vector Databases
Vector databases, such as FAISS (Facebook AI Similarity Search), Annoy, and Milvus, store and retrieve high-dimensional vectors (e.g., embeddings from deep learning models). K-Means helps in:
-
Efficient Indexing & Clustering
- Vectors are clustered into groups so that similar items are stored together.
- When searching for similar vectors, only relevant clusters are searched instead of scanning the entire database.
-
Hierarchical Clustering for Fast Retrieval
- Hierarchical K-Means (HK-Means) is often used, where data is organized into multiple levels of clusters.
- Reduces search complexity from O(N) to O(log N).
-
Quantization Techniques (Product Quantization - PQ)
- K-Means is used in Product Quantization (PQ) for compressing high-dimensional vectors.
- Helps in reducing storage and computational costs in large-scale similarity search.
Example: Using K-Means for Vector Search in FAISS
Here’s an example of using K-Means clustering in FAISS, a popular vector search library.
import numpy as np
import faiss

# Generate random high-dimensional vectors (e.g., embeddings from a neural network)
num_vectors = 10000
dim = 128  # Vector dimension
data = np.random.rand(num_vectors, dim).astype('float32')

# Number of clusters (K)
num_clusters = 100

# Initialize K-Means clustering in FAISS
kmeans = faiss.Kmeans(d=dim, k=num_clusters, niter=20, verbose=True)
kmeans.train(data)

# Assign cluster labels to vectors
D, I = kmeans.index.search(data, 1)  # Find closest cluster for each vector

print("Cluster Assignments:", I[:10])
Why Use K-Means in FAISS?
- Speeds up search by clustering similar vectors.
- Reduces the number of comparisons needed during retrieval.
- Helps in organizing large-scale vector databases efficiently.
K-Means in Other Vector Databases
- Milvus
- Uses K-Means for clustering and indexing in high-dimensional space.
- Annoy (Approximate Nearest Neighbors Oh Yeah!)
- Uses hierarchical K-Means for building tree-based indexes.
- ScaNN (Google’s Scalable Nearest Neighbors)
- Uses K-Means and quantization for efficient similarity search.
Limitations of K-Means in Vector Databases
Not always optimal for non-uniform data distributions
Sensitive to the choice of K (number of clusters)
Alternative methods like Hierarchical Navigable Small World (HNSW) can outperform K-Means in certain cases