From Fuel Protests to Fiscal Risk: What’s Really Happening in Ireland

Executive Summary
This post applies a simple, testable framework to Ireland’s fiscal system:
Fiscal constraint emerges when the cost of debt rises relative to the revenue supporting it.
In large, stable systems like the United States, this dynamic unfolds gradually. Ireland presents a different case.
While headline metrics suggest strength, three structural factors create a distinct risk profile:
- Revenue composition: A significant portion derives from multinational activity and is not fully under domestic control.
- Measurement distortion: The effective economic base (GNI*) is ~43% smaller than GDP implies.
- Debt repricing: Existing debt is being refinanced at materially higher interest rates.
These factors introduce a critical refinement to the model:
It is not only the level of interest that matters, but the reliability of the revenue supporting it.
The result is a system in which:
- Debt servicing costs are rising mechanically through refinancing.
- The stability of a key revenue component is uncertain.
- Fiscal flexibility is narrower than headline figures suggest.
This post develops that model step-by-step using official Irish data (CSO, NTMA, PBO), and shows how structural pressures can emerge even when traditional indicators appear stable.
Key conclusion: Ireland appears strong in level terms, but weaker in structural terms. Constraint binds not when debt is large, but when rising costs and uncertain revenue jointly absorb the system’s annual capacity to generate new fiscal space.
This paper derives a non-arbitrary constraint threshold for Ireland of approximately €4 billion per year in combined fiscal pressure, based on structural revenue growth and debt repricing dynamics.
1. Introduction: From a General Rule to a Specific System
In our previous post, we explored a simple but powerful idea:
Debt does not become a problem because it is large.
It becomes a problem when it begins to constrain the system that supports it.
Using an AI-assisted reasoning process, we refined that idea into a concrete, testable metric:
Interest as a percentage of government revenue
This gave us a way to move beyond vague discussions of “too much debt” and instead ask a precise question:
At what point do interest payments begin to limit what a government can actually do?
In the case of the United States, this led to a clear insight:
Around ~25% of revenue, interest begins to act as a meaningful constraint on the system.
Extending the Framework
That result is useful but only within the context of the system it was derived from.
So the next step is obvious:
What happens when we apply the same framework to a completely different economy?
Why Ireland
In this post, we turn to:
Ireland
At first glance, Ireland appears to be in a strong fiscal position.
- strong headline growth
- manageable debt ratios
- relatively low borrowing costs
Which makes it an ideal test case.
Because if the framework from the U.S. analysis holds, we should expect to see similar dynamics emerging over time.
Surface-Level Fiscal Snapshot
| Metric | Ireland (2025–2026 est.) | Source |
|---|---|---|
| General Government Revenue | €146–152 billion | Department of Finance / NTMA |
| Net Interest Payments | ~€3.3 billion | NTMA |
| Interest / Revenue Ratio | ~2.2% – 2.5% | Calculated |
| Debt-to-GNI* | ~70–75% | CSO / Eurostat |
| Average Debt Maturity | ~8–9 years | NTMA |
| Corporate Tax Share of Revenue | ~25–30% | Department of Finance |
Initial Interpretation
Taken at face value, these numbers suggest:
Ireland is in a very strong fiscal position.
- Interest costs are low relative to revenue
- Debt levels appear manageable
- Revenues are high and growing
Which leads to the obvious conclusion
Ireland does not appear to have a debt problem under conventional metrics.
Why This Section Matters
This is the view most analysts, commentators, and policymakers begin with.
It is:
- clean
- internally consistent
- and supported by official data
This paper follows a structured, iterative analysis to move from surface data to system-level understanding
2. Method: From Surface Observation to Structural Analysis
The fiscal snapshot presented in Section 1 reflects the standard interpretation of Ireland’s position:
- strong revenues
- manageable debt
- no immediate signs of stress
Taken at face value, this would not normally trigger deeper investigation.
Initial Observation
The analysis did not begin with macroeconomic data.
It began with a simple inconsistency:
the visible economic pressure in parts of the domestic economy did not appear to align with the strength implied by headline fiscal figures
This created a starting point for inquiry.
Analytical Approach
Rather than beginning with a fixed hypothesis, the process followed a structured sequence:
- Formulate a concrete question based on observed behaviour
- Interrogate the available data using that question
- Iterate on the results, refining both the question and the model
- Cross-check outputs across multiple AI systems
- Validate conclusions against publicly available data sources
The objective was not to confirm an initial view, but to reduce it.
Role of Iteration
A key feature of the process was iteration.
Early assumptions particularly regarding:
- the strength of the Irish economy
- the scale of fiscal capacity
- and the interpretation of headline indicators
were repeatedly challenged and revised.
This step is essential.
Without iteration, AI tends to reinforce the initial framing of the question.
With iteration, it begins to expose inconsistencies within that framing.
Controlling for Bias
A second objective was to minimise the influence of prior assumptions.
This was addressed by:
- asking narrow, testable questions rather than broad ones
- avoiding leading prompts
- and allowing intermediate conclusions to be challenged
In practice, this meant accepting that:
initial interpretations may be incomplete or incorrect
and allowing the model to adjust accordingly.
Use of Multiple Systems
Where possible, intermediate results were evaluated across multiple AI systems.
The purpose was not to obtain consensus, but to identify:
- points of agreement
- points of divergence
- and areas requiring further validation
This step reduces the risk of relying on a single model’s internal bias.
Validation
All major conclusions were then checked against:
- official statistics (CSO, NTMA)
- published government data
- and institutional analysis (Fiscal Council, PBO, OECD)
The aim was to ensure that:
the final model is grounded in verifiable data, not generated narrative
Outcome of the Process
The analysis did not produce a single isolated insight.
Instead, it revealed a structural pattern:
- headline indicators suggested strength
- underlying measures suggested a smaller domestic base
- revenue was partially dependent on externally driven activity
- and cost dynamics were shifting at the same time
This pattern only became visible when:
- multiple components were considered together
- and the interaction between them was examined
Relation to the Previous Model
In the previous paper, the result was a simple formulation:
Constraint emerges when interest grows faster than revenue
This paper extends that result.
It shows that:
the reliability of revenue is itself a variable
Interpretation
The role of AI in this process is not to provide answers directly.
It is to:
- accelerate the exploration of possible explanations
- test the internal consistency of those explanations
- and assist in converging on a model that fits observed behaviour
The remainder of this paper follows from this process.
It examines:
- how the Irish economy is measured
- how revenue is generated
- how debt is structured
- and how these components interact
Taken together, these elements form the system that supports the State’s fiscal position.
3. The Measurement Problem: Ireland’s Economy Depends on How You Measure It
Before analysing debt, interest, or fiscal sustainability, we need to establish a more basic point:
What is the actual size of the Irish economy?
In our previous framework, debt becomes a constraint when interest rises relative to the system that supports it. That immediately creates a dependency: the model is only as accurate as the system it is measured against. If the denominator is overstated, then debt appears smaller, capacity appears larger, and risk appears lower than it actually is.
GDP and Its Limitations in Ireland
At first glance, Ireland appears to be a large, fast-growing, and fiscally strong economy. This impression is based on GDP.
However, in Ireland’s case, GDP includes a substantial volume of activity that does not reflect the domestic economy. This includes multinational profits booked in Ireland, intellectual property transfers, and global revenue flows that pass through Irish entities but do not remain within the country.
These flows are real in accounting terms, but they are not equivalent to domestic income, consumption, or a stable tax base.
The Role of GNI*
This issue has been formally recognised by Ireland’s own statistical authority, the Central Statistics Office (CSO), which introduced Modified Gross National Income (GNI*) as an adjustment.
GNI* removes the main distortions associated with multinational activity and provides a more accurate estimate of the income actually available within the Irish economy.
Figure 1: GDP vs GNI*
| Metric (2024) | Value |
|---|---|
| GDP | ~€562bn |
| GNI* | ~€321bn |
| Gap | ~43% |
Figure 2: GDP vs GNI*
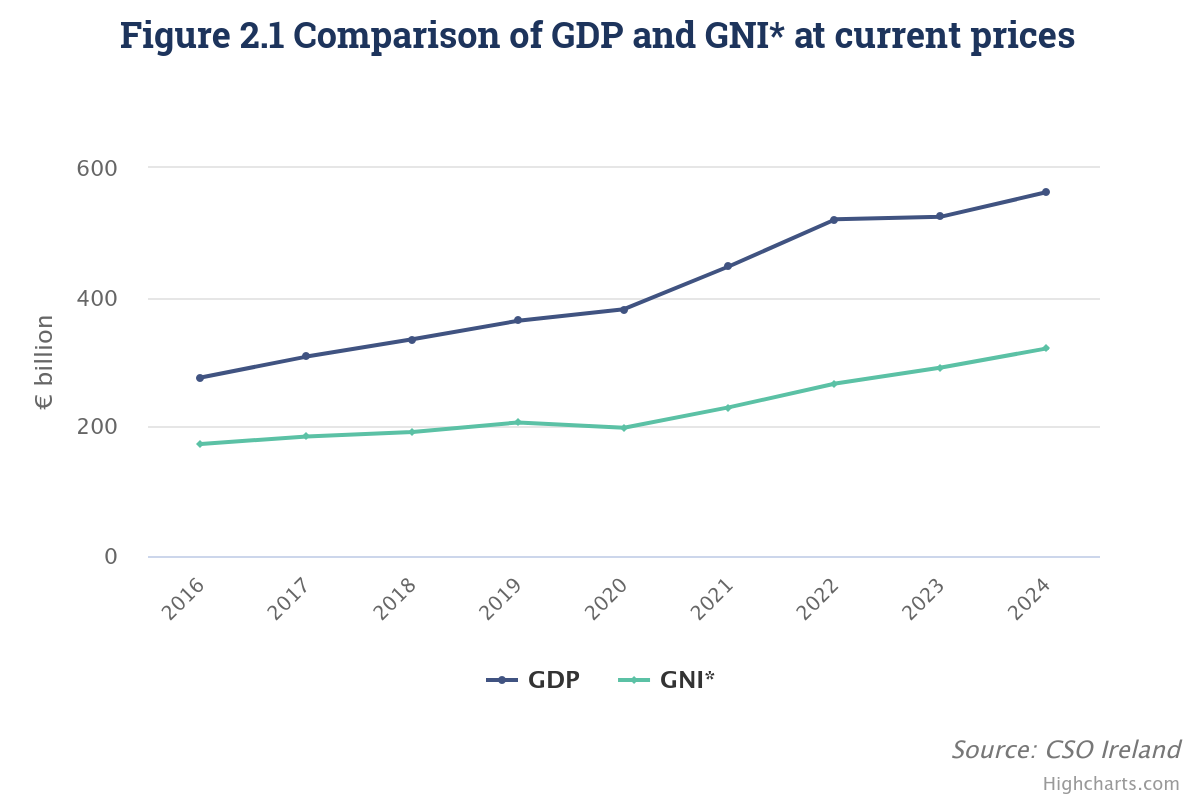
Source: CSO National Accounts
The difference is material. GDP exceeds GNI* by roughly 40–45%, implying that a significant portion of measured economic activity does not belong to the domestic system.
This leads to a practical distinction between two overlapping economies:
- a headline economy, driven by multinational activity and global integration
- a domestic economy, which is smaller and grows more gradually
This distinction is essential when evaluating fiscal capacity.
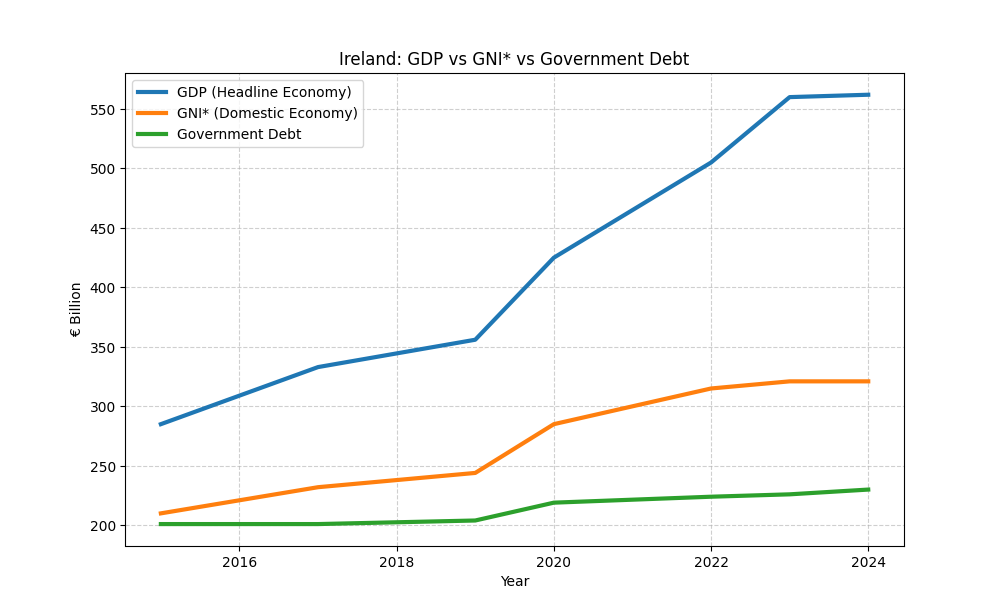
Implications for Debt Measurement
When debt is measured against GDP, ratios appear low and manageable. When measured against GNI*, those ratios increase materially, reflecting a smaller underlying base.
This should not be interpreted as immediate fiscal distress. Even using GNI*, debt levels remain broadly stable relative to the domestic economy. However, it does mean that the system is more constrained than GDP-based metrics suggest.
Figure 3: GDP, GNI, and Debt*
Revenue Structure: The Missing Link
Understanding the size of the economy is only part of the problem. The more important question for this model is:
What actually generates government revenue?
Ireland’s tax base can be simplified into two components.
Domestic Revenue Base
This includes:
- income tax
- VAT
- domestic business activity
This portion of revenue is broadly aligned with GNI*. It reflects the internal economy and tends to grow steadily over time.
Multinational-Driven Revenue
This includes:
- corporation tax
- profits linked to multinational firms
- revenues associated with global profit allocation
This component is materially different. It is:
- concentrated in a small number of firms
- influenced by global tax rules
- not fully under domestic control
Revenue Breakdown (Approximate)
| Component | Value |
|---|---|
| Total Revenue | ~€150bn |
| Corporate Tax | ~€30–35bn |
| Share of Revenue | ~20–25% |
A relatively small number of multinational firms account for a disproportionate share of this corporate tax base.
Interpretation
This creates a structural feature of the Irish system:
- GDP is significantly influenced by multinational activity
- a meaningful share of government revenue is also derived from that same activity
These are not independent effects. They are two expressions of the same underlying dynamic.
Sensitivity to Change
Because of this structure, the system does not need to break for fiscal conditions to change.
Even moderate shifts in multinational behaviour can have measurable effects on revenue.
Illustrative Scenarios
| Scenario | Revenue Impact |
|---|---|
| -10% corporate tax | -€3bn |
| -30% corporate tax | -€10bn |
| -50% corporate tax | -€15bn |
These are not extreme assumptions. They reflect partial adjustments within a concentrated revenue base.
Implications for the Model
This leads to a refinement of the original framework.
The constraint is not simply:
Interest relative to total revenue
It is:
Interest relative to a revenue base that is partly stable and partly externally driven
In this structure, even if interest levels remain moderate, the system can tighten if the externally driven component weakens.
Conclusion of This Section
Ireland’s fiscal position is influenced by a single underlying factor expressed in two ways:
- multinational activity inflates the apparent size of the economy
- the same activity contributes disproportionately to government revenue
This creates a system in which:
- the domestic base (GNI*) is stable but limited
- the overall revenue base is larger, but partly dependent on external conditions
The implication is not immediate instability. It is dependence.
This becomes critical when considering how changes in global tax rules may affect both measured economic activity and the revenue that supports the state.
The next section examines this directly:
what happens when the conditions supporting multinational-driven revenue begin to change
Figure 4: The Two-Sided Pressure Model
    flowchart LR
    %% Styles
    classDef revenue fill:#e3f2fd,stroke:#1565c0,stroke-width:2px,color:#0d47a1
    classDef cost fill:#ffebee,stroke:#c62828,stroke-width:2px,color:#b71c1c
    classDef constraint fill:#f3e5f5,stroke:#6a1b9a,stroke-width:2px,color:#4a148c
    classDef signal fill:#fff3e0,stroke:#ef6c00,stroke-width:2px,color:#e65100

    subgraph Revenue_Side["💵 Revenue Side"]
        A["🏢 Multinational<br>Revenue Concentration"] --> B["❓ Revenue<br>Uncertainty"]
        C["🌐 OECD Pillar Two<br>Changes"] --> B
        B --> D["📉 Reduced<br>Reliable Revenue"]
    end

    subgraph Cost_Side["💸 Cost Side"]
        E["🏦 Debt Stock<br>~€230bn"] --> F["🔄 Refinancing<br>Cycle"]
        F --> G["📈 Higher Market<br>Rates ~3-3.5%"]
        G --> H["💰 Increasing<br>Interest Costs"]
    end

    subgraph Constraint["⚖️ System Constraint"]
        D --> I["🔒 Reduced Fiscal<br>Flexibility"]
        H --> I
        J["🏛️ Fixed Core<br>Expenditure"] --> I
        I --> K["🚧 Policy<br>Constraint"]
    end

    K --> L["📊 Limited Discretionary<br>Margin ~€5-10bn"]
    L --> M["🚨 Real-World<br>Pressure Signals"]
    M --> N["⛽ Fuel Protests /<br>Sectoral Strain"]

    %% Apply classes
    class A,C,B,D revenue
    class E,F,G,H cost
    class I,J,K constraint
    class L,M,N signal
This diagram illustrates the twin forces acting on Ireland’s fiscal position. The Revenue Side (blue) shows how concentrated multinational receipts and OECD tax changes introduce uncertainty into the State’s reliable income base. The Cost Side (red) shows how existing debt stock is being refinanced at significantly higher interest rates, mechanically increasing annual servicing costs. Both forces converge in the System Constraint (purple), where fixed core expenditure limits the government’s ability to absorb shocks, reducing fiscal flexibility and generating real-world pressure signals (orange) such as sectoral strain and protests.
4. The OECD Shift: Structural Change in the Revenue Model
Up to this point, the analysis has focused on measurement.
- GDP overstates the size of the domestic economy
- GNI* provides a more accurate baseline
- a significant share of government revenue is linked to multinational activity
These factors describe the structure of the system.
This section examines a change to that structure.
Background
For several decades, Ireland’s economic model included a clear and well-understood feature:
multinational firms could book profits through Ireland under a relatively low effective tax regime
Ireland’s statutory corporation tax rate of 12.5% formed part of this framework. In practice, the effective tax rate for certain multinational structures was often lower due to the treatment of intellectual property and profit allocation.
This model was not unique to Ireland, but Ireland became one of the most prominent jurisdictions in which it operated.
Policy Response
This framework has been progressively challenged at both EU and OECD level.
The most significant recent development is the OECD’s Pillar Two reform, which introduces a global minimum effective tax rate of 15% for large multinational groups.
Ireland has adopted this framework, applying the 15% rate to firms within scope, while retaining the 12.5% rate for smaller domestic firms.
Nature of the Change
This is not a removal of Ireland’s economic model.
Ireland retains several structural advantages:
- an English-speaking base within the EU
- an established multinational ecosystem
- legal and administrative continuity
However, one of the key features of the previous model the ability to reduce effective tax rates through profit allocation has been reduced.
The relevant change is therefore not location, but behaviour:
how multinational firms allocate profits across jurisdictions
Revenue Concentration
This matters because Ireland’s corporation tax base is highly concentrated.
Available estimates indicate:
- a small number of firms account for a large share of receipts
- the top three firms accounted for approximately 38% of corporation tax in 2023
- the top ten firms accounted for approximately 57–60% by 2024
This concentration implies that changes in the behaviour of a small number of firms can have a material impact on total revenue.
Transmission Mechanism
The key transmission channel is not firm exit.
It is:
- changes in profit booking
- changes in intellectual property location
- changes in intra-group pricing structures
These adjustments can occur without any visible relocation of operations.
As a result, changes in global tax rules can affect:
- reported profits in Ireland
- corporation tax receipts
- headline GDP
without requiring firms to physically leave the country.
Timing Effects
There is also evidence of timing effects associated with the transition.
The OECD’s 2025 Economic Outlook notes that part of recent strength reflects front-loading of activity, with positive carryover expected to diminish in subsequent periods.
This suggests that some portion of recent:
- GDP growth
- corporate tax receipts
may reflect timing adjustments rather than permanent increases.
Interpretation
Taken together, these factors imply a transition:
- from a system in which profit-booking dynamics strongly favoured Ireland
- to a system in which those dynamics are more constrained and externally determined
This does not imply a discontinuity in the real economy.
It does imply a change in the behaviour of the revenue layer identified in Section 3.
Implications for the Fiscal Model
The framework developed earlier can now be extended.
Ireland’s fiscal position depends on:
- a domestic revenue base linked to GNI*
- an additional revenue layer linked to multinational activity
The OECD reform primarily affects the second component.
Key Result
If the multinational-driven component becomes:
- smaller
- more volatile
- or less predictable
then:
the total revenue base becomes less stable, even if the domestic economy remains unchanged
Conclusion
The OECD reform does not create a new vulnerability.
It exposes an existing one.
Ireland’s fiscal position remains manageable in level terms.
However, the structure supporting that position becomes more dependent on:
- external rules
- firm-level decisions
- and global tax coordination
This becomes critical when combined with the next component of the system:
the repricing of government debt in a higher interest rate environment
5. The Rollover Shock: Repricing the Cost of Debt
Sections 3 and 4 established two structural features of the Irish system:
- the effective economic base is smaller than headline GDP suggests
- a material share of government revenue depends on multinational-driven activity
These affect the capacity of the system.
This section examines the cost side.
Debt as a Rolling Obligation
Government debt is not static. It must be continuously refinanced as existing bonds mature.
This creates a simple constraint:
the cost of debt is determined by current market conditions, not historical ones
Over the past decade, Ireland benefited from an unusually favourable interest rate environment.
- average borrowing costs were approximately 1.5%–1.8%
- in several periods, new issuance occurred at or near 0%
This allowed the State to carry a substantial debt stock at relatively low cost.
That environment has now changed.
Recent issuance has taken place at approximately:
3%–3.5%
This represents a structural shift in the price of borrowing.
Figure 5: Interest Rate Regime Shift
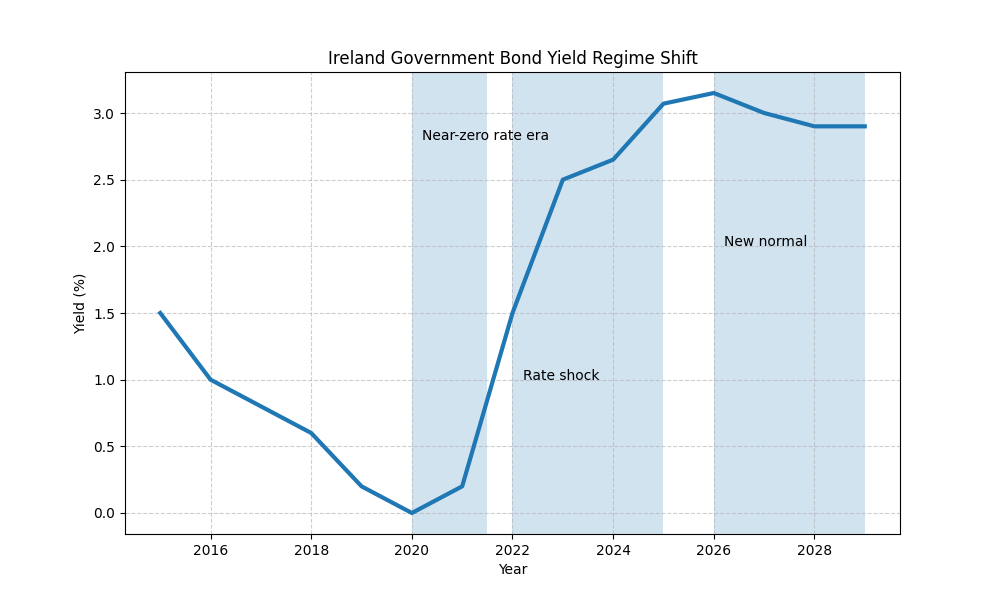
In practical terms:
debt previously financed at ~1.5% is now being refinanced at ~3–3.5%
The Refinancing Cliff
This shift is not theoretical. It is tied to specific maturities.
In 2026, Ireland faces a significant refinancing requirement:
approximately €15 billion of government debt reaches maturity
This debt must either be repaid or refinanced at current market rates.
The implication is mechanical.
Replacing debt issued at very low rates with new borrowing at ~3–3.5% creates an immediate increase in annual interest costs.
A simplified estimate:
- legacy cost (~1%) on €15bn → ~€150 million annually
- new cost (~3.5%) → ~€500+ million annually
This implies an incremental cost of approximately €350–400 million per year from this tranche alone
This increase is:
- non-discretionary
- immediate upon refinancing
- and recurring over the life of the new debt
Ireland’s total government debt is approximately:
€230 billion
Beyond the 2026 maturity, a broader portion of the debt stock will be rolled over in the coming years.
Estimates suggest:
€40–50 billion of debt will be refinanced over the near term
Cumulative Effect
As this refinancing progresses:
- older, low-cost debt is gradually replaced
- the average cost of debt rises
- and annual interest expenditure increases accordingly
A reasonable aggregate estimate is that:
annual interest costs increase by approximately €700 million to €1 billion over the refinancing cycle
It is important to distinguish between:
- debt levels, which remain broadly stable relative to GNI*
- debt costs, which are now increasing
Ireland did not materially reduce its debt stock during the period of strong headline growth.
Measured against GNI*, debt remains significant, even if it appears moderate relative to GDP.
This is where the model becomes more precise.
From Section 3:
- part of the revenue base is stable and domestically generated
- part is externally driven and less predictable
From Section 4:
- the external component is subject to structural change
The system now experiences two simultaneous movements:
- the cost of debt increases, driven by refinancing at higher rates
- the reliability of the revenue base decreases, due to external dependence
Individually, these changes are manageable.
Their significance lies in their interaction.
Rising costs combined with a less predictable revenue base reduce fiscal flexibility
Ireland’s position remains manageable in level terms.
However, the structure of the system is changing.
- the effective economic base is smaller than headline measures suggest
- part of the revenue supporting the system is externally determined
- and the cost of servicing debt is rising as legacy conditions unwind
The system tightens not through an expansion of debt, but through the repricing of its cost
This becomes more visible when we examine how government resources are allocated:
where revenue is already committed, and how much flexibility remains
6. The Underlying Position: Surplus, Deficit, and Measurement
At a headline level, Ireland’s fiscal position appears strong. Recent budgets have recorded surpluses, debt ratios are low when measured against GDP, and interest costs remain modest relative to total revenue.
However, this interpretation depends on two assumptions:
- that current revenue levels are sustainable
- and that GDP accurately reflects the economic base supporting that revenue
Both assumptions are questioned by Ireland’s own fiscal institutions.
Analysis by the Parliamentary Budget Office shows that when a portion of corporation tax receipts is classified as “windfall” and excluded, the fiscal position changes materially.
Under this adjustment, Ireland is projected to run underlying deficits of approximately €7.4 billion in 2025 and €14.3 billion in 2026, rather than surpluses.
This is not a forward projection, but a restatement of the current fiscal position under a different revenue classification revealing that the reported surplus depends on treating volatile receipts as permanent.
This implies that the current surplus is dependent on a revenue component that fiscal authorities do not treat as permanent.
This interpretation is consistent with guidance from the Department of Finance, which has emphasised that a meaningful share of recent revenue growth is linked to multinational activity and should not be assumed to persist.
The practical effect is that the fiscal position can be viewed in two ways.
At the surface level, total revenue of approximately €150 billion supports expenditure of roughly €130–140 billion, producing a surplus.
When windfall corporation tax is treated as temporary, the underlying revenue base is lower. Against the same level of expenditure, this implies a system operating closer to balance, and in some scenarios, in deficit.
This adjustment becomes more significant when considered alongside how fiscal capacity is measured.
European fiscal rules are based on GDP, and by that measure Ireland appears comfortably within the 60% debt threshold. However, as discussed earlier, GDP in Ireland includes a substantial component of multinational-driven activity that does not fully reflect the domestic economy.
When debt is considered relative to GNI* a measure designed by the Central Statistics Office to better reflect domestic income the ratio is materially higher. While still manageable, it is closer to the levels typically associated with more constrained fiscal systems.
Figure 6: Debt Ratio GDP vs GNI
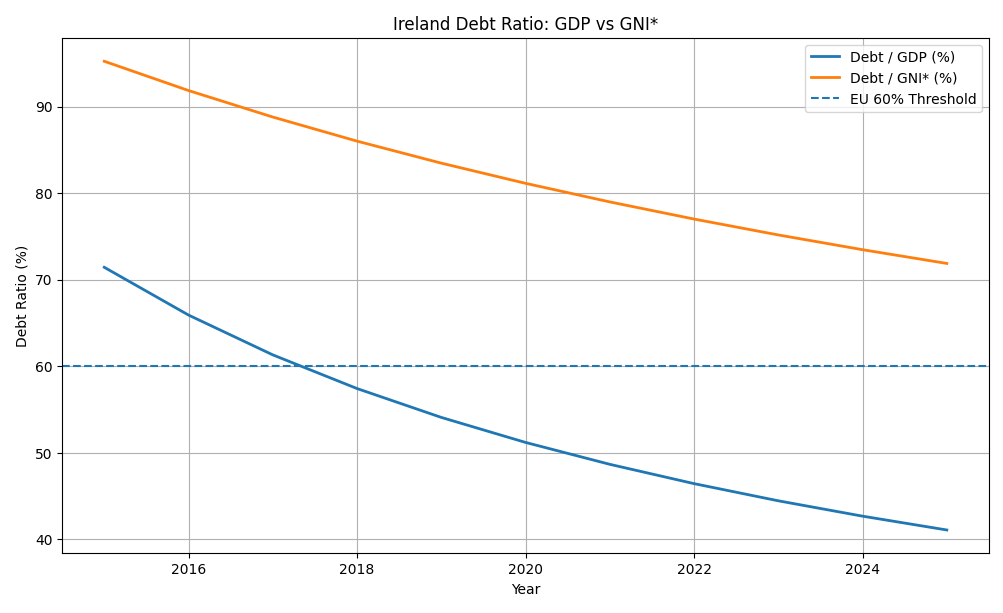
Ireland is not operating outside European fiscal rules, nor is it facing immediate stress. However, the comparison highlights that the margin between revenue and expenditure, and between debt and underlying economic capacity, is narrower than headline GDP-based metrics suggest.
It also helps explain observed policy behaviour.
- Caution in committing to permanent spending increases
- Reluctance to reduce tax revenues, even under pressure
- Continued allocation of resources to reserve funds
These actions are consistent with a system that recognises the distinction between total revenue and reliable revenue, and that is managing its position accordingly.
The interaction with recent global tax changes further reinforces this interpretation.
If multinational-driven revenue becomes less concentrated or less predictable under OECD reforms, both the measured size of the economy and the revenue base supporting public finances may adjust at the same time. In that scenario, a position that appears comfortably in surplus on a GDP basis may move closer to balance or deficit when assessed against a more stable measure of income.
Ireland’s fiscal position remains broadly stable by conventional measures. However, when viewed through the combined lens of:
- adjusted revenue (excluding windfall components)
- and adjusted economic scale (using GNI*)
the system appears more tightly balanced.
This does not indicate a crisis. Rather, it reflects a system operating with less margin for error than headline figures imply, particularly in an environment where both revenue composition and economic measurement are subject to change.
Figure 7: What Moves the Needle Most?
| Variable | Impact on Constraint Timeline |
|---|---|
| Corporate tax concentration (-10%) | +2-3 years earlier |
| Refinancing rate +1ppt | +1-2 years earlier |
| GNI* growth -1ppt | +1 year earlier |
| Legacy debt repricing | Immediate €700m-€1bn cost increase |
Key insight: Revenue concentration and refinancing dynamics dominate.
The precise threshold at which this constraint binds can be derived from the interaction of these components. This is formalised in Appendix A.
7. The Legacy Burden: Scale and Structural Impact
A material portion of Ireland’s current sovereign debt does not originate from recent fiscal policy or ongoing economic activity. It originates from the financial crisis.
Estimates from the Central Bank of Ireland indicate that approximately €60–65 billion of Ireland’s debt can be traced to crisis-era banking interventions. Relative to the current debt stock of roughly €220–230 billion, this represents around one-quarter to one-third of total government debt.
For much of the past decade, this component of the debt was carried in an environment defined by exceptionally low interest rates, long maturities, and minimal servicing costs. Under those conditions, its impact on the fiscal system remained limited.
That environment has now changed.
As this debt is refinanced, borrowing costs are moving from approximately 1.5% toward 3–4%, with a corresponding increase in annual interest expenditure. Debt that was previously inexpensive to carry becomes a direct and growing claim on current revenue.
The scale of this legacy component is therefore significant. It is not a marginal feature of the balance sheet, but a structural element whose magnitude is comparable to the contribution of multinational-driven revenues to the Exchequer, but operates in the opposite direction.
This provides a useful way to interpret the system. Multinational activity has acted as a positive external layer, augmenting the State’s revenue base, while crisis-era debt represents a negative structural layer carried forward from past interventions.
Ireland can thus be understood as operating with three interacting components: a stable domestic base, an externally influenced revenue layer, and a legacy debt layer embedded within the sovereign balance sheet.
Under the low-rate conditions of the previous decade, these components coexisted without immediate tension. Under current conditions, however, their interaction becomes more restrictive. The external revenue layer is subject to increasing uncertainty, while the legacy debt layer is being repriced at higher rates.
The result is a simultaneous tightening of the system from both sides.
The relevance of the legacy burden is therefore not historical but mechanical. A substantial inherited portion of Ireland’s debt is now being refinanced in a higher-rate environment, increasing its ongoing impact on fiscal capacity.
8. Where the Money Actually Goes: The Real Constraint
Up to this point, the analysis has examined measurement, revenue composition, and debt dynamics. This leads to a practical question: if Ireland generates approximately €150 billion in annual revenue, why does the system appear constrained?
At a surface level, the arithmetic suggests a comfortable position. Government revenue is on the order of €150 billion, expenditure approximately €130–140 billion, and interest costs around €3–4 billion. On this basis, the system appears to generate a surplus and to possess meaningful fiscal capacity.
This interpretation, however, depends on treating all revenue as equally available. As discussed in the previous section, fiscal authorities distinguish between structural (reliable) revenue and windfall (less reliable) revenue, particularly in relation to corporation tax receipts linked to multinational activity. When this distinction is applied, the effective revenue base is reduced. A simplified adjustment suggests a structural revenue range of approximately €115–125 billion against expenditure of €130–140 billion, placing the underlying position much closer to balance and, in some cases, in deficit.
Understanding this adjustment requires examining the composition of expenditure. Government spending is concentrated in a small number of large categories, including health services, social protection, public sector pay, education, infrastructure and housing, and debt servicing. These are not discretionary allocations but core functions of the State. Their defining characteristic is not simply their scale, but their rigidity. They are ongoing, politically and socially sensitive, and difficult to reduce within any meaningful policy horizon. As a result, a substantial portion of total expenditure can be considered fixed in the short term.
The remaining portion of the budget that can be adjusted is comparatively limited. It consists primarily of changes in the timing of capital investment, allocations to reserve funds such as the Future Ireland Fund, and certain temporary or discretionary supports. These areas represent the practical margin within which policy adjustments can occur.
This distinction clarifies why relatively small fiscal changes can have a disproportionate impact. While a €1–2 billion adjustment appears modest when measured against total revenue, it represents a meaningful share of the system’s remaining flexibility when measured against the adjusted, reliable revenue base. The apparent scale of resources therefore overstates the degree of actual policy freedom.
The constraint that emerges is not one of aggregate income, but of composition and commitment. A significant portion of revenue is either externally driven or treated as non-structural, while a large share of expenditure is effectively fixed. At the same time, debt servicing costs are increasing as existing liabilities are refinanced at higher rates. The interaction of these factors reduces the system’s effective margin.
This framework helps to explain observed policy behaviour. Reluctance to reduce tax revenues, limited responsiveness to sector-specific pressures, and continued allocation to reserve funds are consistent with a system that is managing not total revenue, but reliable revenue.
Ireland’s fiscal position is therefore best understood not as a function of total resources, but as the interaction between revenue composition, expenditure rigidity, and rising financing costs. The result is a system in which flexibility is more limited than headline figures suggest, and in which relatively small adjustments carry increasing significance.
A Practical Constraint: The Discretionary Margin
The analysis can be simplified by focusing on the portion of revenue that is not already committed.
Using earlier estimates:
- structural (reliable) revenue: ~€115–125 billion
- core expenditure (health, pensions, wages, services): ~€105–110 billion
This leaves a residual:
approximately €5–10 billion per year
This represents the system’s effective discretionary margin.
This margin is not excess in a conventional sense.
It is:
- the space available for policy response
- the capacity to absorb shocks
- and the buffer against uncertainty
Constraint emerges when this margin is fully absorbed by:
- rising interest costs
- and/or reductions in reliable revenue
Even relatively small changes:
- €1–2 billion in additional interest
- or €3–5 billion in revenue loss
can materially reduce this margin.
The system does not need to run out of money to become constrained. It only needs to run out of flexibility.
Most expenditure is not discretionary over a short-to-medium horizon. This limits the State’s ability to respond to shocks without reducing services or increasing borrowing.
9. Counter-Argument: Interpreting Ireland Within a European Context
A common counter-position is that Ireland’s fiscal position remains strong when viewed in a European context.
This argument is based on several observable features:
- debt levels, when measured against GNI*, are moderate relative to historical European cases
- Ireland operates within the Eurozone, with access to ECB liquidity and institutional support
- headline fiscal balances remain in surplus
- and the State has begun accumulating reserves through vehicles such as the Future Ireland Fund
From this perspective, Ireland can be viewed as:
a well-capitalised sovereign operating within a supportive monetary and institutional framework
This interpretation is not without merit.
When compared to economies that have experienced acute fiscal stress such as Greece or Spain during the European debt crisis Ireland’s position appears materially stronger.
In particular:
- debt dynamics are more stable
- market access remains intact
- and institutional credibility is comparatively high
However, this comparison introduces an important limitation.
These economies were not, at the time, presented as structurally strong or high-performing systems. They were recognised as economies under stress, with visible imbalances and constrained fiscal positions.
Ireland, by contrast, is widely presented as:
a high-growth, high-income economy with strong fiscal performance
The relevance of this distinction is analytical rather than rhetorical.
The framework developed in this paper does not assess strength solely in relative terms that is, whether one system is stronger than another under stress.
Instead, it evaluates:
the internal consistency and sustainability of the system itself
This requires shifting from static comparisons to dynamic interactions.
Specifically:
- the composition and reliability of the revenue base
- the evolution of debt servicing costs under refinancing
- and the degree of flexibility within the expenditure structure
Within this framework, the key issue is not whether Ireland is currently stable.
It is whether:
the system retains sufficient flexibility as underlying conditions change
When assessed in these terms, the conclusions differ from those suggested by relative comparison alone.
Ireland’s fiscal position remains stable in level terms.
However, when evaluated through the interaction of:
- revenue concentration and external dependence
- rising financing costs
- and limited discretionary capacity within the budget
the margin for adjustment appears narrower than conventional metrics imply
This does not contradict the view that Ireland is stronger than past crisis economies.
It refines it.
Ireland may be relatively strong but still structurally sensitive to changes in the system supporting that strength
The distinction, therefore, is not between strength and weakness, but between appearance and structure.
A system can appear robust in static terms while becoming more constrained in dynamic terms.
These comparisons are valid in level terms, but do not capture the interaction between revenue volatility and rising costs. Ireland’s profile is therefore closer to a high-variance system than a high-debt system.
10. The Signal: Protests as a Constraint Indicator
The preceding sections have focused on structural characteristics of the Irish fiscal system: measurement distortions, revenue composition, debt dynamics, and expenditure rigidity. These elements describe the system in abstract terms. However, when constraints begin to bind, they tend to manifest in observable economic behaviour.
In Ireland, this has taken the form of fuel-related protests involving hauliers, farmers, and small businesses whose operations are highly sensitive to diesel and heating costs.
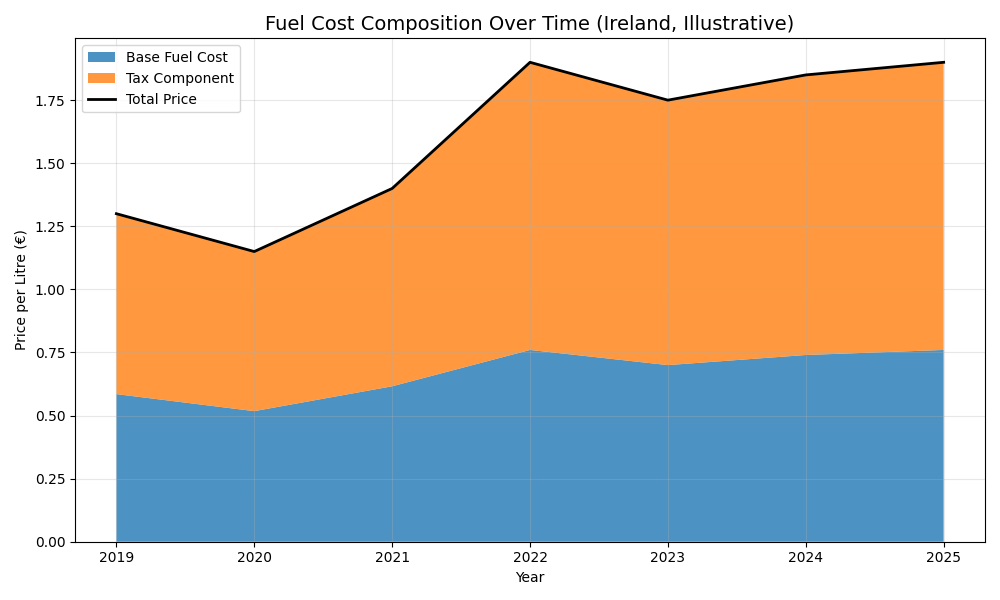
The argument presented by these groups is straightforward. Fuel prices have increased materially, and a significant proportion of the final price commonly estimated at 50–60% consists of taxes and levies. From this perspective, a portion of the cost increase is not purely market-driven but arises from policy.
The proposed response follows directly from this framing: a reduction or temporary removal of the incremental tax burden associated with higher fuel prices. This is not typically presented as a permanent structural change, but as a targeted adjustment intended to restore economic viability in affected sectors.
This position is internally consistent. If input costs have increased sharply and margins have not adjusted, then reducing the policy-driven component of those costs appears to offer immediate relief.
Figure 8: Composition of Fuel Costs (Illustrative)
The question, therefore, is not whether the pressure exists, but how it interacts with the broader fiscal system.
Within the framework developed in earlier sections, government decision-making is constrained not by total revenue, but by the portion of that revenue considered reliable. When windfall or externally driven components are excluded, the underlying fiscal position moves closer to balance or deficit. At the same time, expenditure remains largely fixed in the short term, and debt servicing costs are increasing as refinancing occurs at higher rates.
In this context, a reduction in fuel-related taxation estimated in the range of €1–2 billion takes on a different significance. While modest relative to total revenue, it represents a meaningful share of the system’s remaining fiscal flexibility. Accommodating such a reduction would likely require offsetting adjustments elsewhere in the budget, at a similar order of magnitude.
The practical implication is that policy responses are shaped by trade-offs between competing uses of limited discretionary capacity. Even where a policy lever exists in principle, its use is constrained by the absence of equally scalable and immediately adjustable alternatives.
This helps reconcile two observations that might otherwise appear inconsistent: the presence of clear and immediate economic pressure in specific sectors, and a limited fiscal response at the policy level.
From a system perspective, the protests are not an isolated phenomenon. They represent a point at which structural conditions uncertain revenue composition, fixed expenditure commitments, and rising debt servicing costs intersect with real-world economic activity.
The position of the affected sectors reflects conditions at the microeconomic level:
costs have increased, and policy contributes to those costs.
The position of the State reflects constraints at the system level:
fiscal capacity is more limited than aggregate figures suggest.
The interaction of these positions reveals a broader dynamic. Constraint is not expressed solely through headline indicators such as debt ratios or interest burdens. It becomes visible when the system encounters demands for adjustment that it cannot accommodate without material reallocation.
In this sense, the protests function as an early signal. They indicate that the margin for policy flexibility is narrower than surface-level metrics imply, and that competing claims on that margin are beginning to emerge.
The protests do not create the constraint. They reveal it.
The forward-looking implication is not one of immediate crisis, but of increased sensitivity. As revenue composition evolves and debt servicing costs rise, the system’s ability to absorb additional shocks or policy demands may become more limited.
The constraint, therefore, is not only quantitative. It is operational: a reduced capacity to respond to pressures as they arise.
11. Model Refinement: From Interest/Revenue to Interest/Reliable Revenue
The original framework defined fiscal constraint as:
Interest relative to total revenue
The Irish case suggests a necessary refinement:
Constraint ≈ Interest / Reliable Revenue
Where:
- Reliable revenue excludes volatile, externally-driven components (notably concentrated corporate tax receipts subject to global policy shifts).
- Reliable revenue reflects the sustainable domestic base that can be counted on across economic cycles.
This refinement explains why constraint can emerge at lower absolute interest levels in systems with less stable revenue bases and why Ireland’s position requires this adjusted lens.
The framework is therefore applicable beyond Ireland to any small, open economy with a concentrated revenue source or a large external shock absorber.
Figure 9: The Amplification Feedback Loop
    flowchart LR
    %% Styles (matching first diagram)
    classDef revenue fill:#e3f2fd,stroke:#1565c0,stroke-width:2px,color:#0d47a1
    classDef cost fill:#ffebee,stroke:#c62828,stroke-width:2px,color:#b71c1c
    classDef constraint fill:#f3e5f5,stroke:#6a1b9a,stroke-width:2px,color:#4a148c
    classDef signal fill:#fff3e0,stroke:#ef6c00,stroke-width:2px,color:#e65100

    %% Main Feedback Loop
    A["❓ Revenue<br>Uncertainty"] --> B["📉 Reduced Fiscal<br>Capacity"]
    B --> C["🚧 Limited Policy<br>Response"]
    C --> D["⚠️ Economic Pressure /<br>Sectoral Strain"]
    D --> E["📉 Reduced Domestic<br>Activity"]
    E --> A

    %% External Drivers
    F["🔄 Debt Refinancing<br>at Higher Rates"] --> G["💰 Higher Annual<br>Interest Costs"]
    G --> B

    H["🌐 OECD / Global<br>Tax Changes"] --> A

    %% Apply classes
    class A,E,H revenue
    class F,G cost
    class B,C constraint
    class D signal
This diagram shows how initial constraints can become self-reinforcing. Revenue uncertainty (blue) reduces fiscal capacity (purple), which limits the government’s policy response. This in turn creates economic pressure (orange), which dampens domestic activity and feeds back into further revenue uncertainty—closing a negative loop. External drivers such as debt refinancing at higher rates (red) and global tax changes (blue) act as amplifiers, injecting additional stress into the cycle. The loop illustrates why fiscal constraint, once triggered, can escalate beyond the impact suggested by static ratios alone.
Applying This Model Elsewhere
This framework is not Ireland-specific. To assess fiscal constraint in any small, open economy:
- Identify the reliable vs. volatile components of revenue
- Map the debt refinancing schedule and rate trajectory
- Estimate the discretionary margin (reliable revenue − fixed expenditure)
- Monitor when (ΔI + ΔR) approaches ΔS
Appendix A: Deriving the Constraint Threshold
The main body of this paper argues that Ireland’s fiscal constraint cannot be understood through debt levels or interest costs alone. It depends on the interaction between rising debt servicing costs and the reliability of the revenue base supporting those costs.
This appendix formalises that argument using the figures developed in the paper. The purpose is not to produce a precise forecast, but to derive a non-arbitrary threshold condition from the structure of the Irish system itself.
A.1 The Core Principle
In the earlier U.S. analysis, the relevant condition was:
constraint emerges when interest grows faster than revenue
That framework remains valid, but the Irish case requires an additional distinction.
Not all revenue is equally reliable. A portion of Irish revenue is linked to multinational activity and is therefore more volatile, more concentrated, and more exposed to external rule changes than the domestic tax base.
For this reason, the relevant variable is structural revenue that is revenue that can reasonably be expected to persist in the absence of windfall corporation tax receipts.
The Irish constraint condition can therefore be expressed as follows:
constraint emerges when the combined effect of rising interest costs and falling reliable revenue exceeds the annual growth in structural revenue
In symbolic form:
ΔI + ΔR ≥ ΔS
Where:
- ΔI = annual increase in interest costs
- ΔR = annual loss of reliable revenue
- ΔS = annual growth in structural revenue
This is the threshold condition used in the analysis.
A.2 Structural Revenue
From Sections 6 and 8, structural revenue excluding the portion of corporation tax classified as windfall is estimated at approximately:
€115–125 billion
Using the midpoint:
S ≈ €120 billion
This provides the best working estimate of the revenue base that can be treated as structurally reliable.
A.3 Growth in Structural Revenue
The domestic economy, proxied by GNI*, is estimated in the main text at approximately:
€321 billion
Nominal growth in this domestic base can reasonably be approximated at:
3–4% per annum
Using a midpoint assumption of:
g ≈ 3.5%
annual growth in structural revenue can be estimated as:
ΔS = g × S
Substituting the values:
ΔS = 3.5% × €120bn ≈ €4.2 billion per year
This €4.2 billion represents the system’s approximate annual fiscal headroom before additional policy commitments.
A.4 Interest Cost Repricing
Section 5 estimated that:
- €40–50 billion of debt will be refinanced in the near term
- the effective refinancing rate shift is approximately +2 percentage points
- the 2026 refinancing requirement alone is approximately €15 billion
Using the estimates already developed in the paper, the annual increase in interest costs associated with this repricing cycle is approximately:
ΔI ≈ €0.7–1.2 billion per year
A reasonable working estimate is therefore:
ΔI ≈ €1.2 billion
This is not a forecast of total interest costs, but an estimate of the incremental annual pressure imposed by refinancing.
A.5 Current Position Relative to Headroom
Using the baseline values:
- ΔS ≈ €4.2bn
- ΔI ≈ €1.2bn
- ΔR ≈ €0bn (baseline case)
the current pressure ratio is:
(ΔI + ΔR) / ΔS = €1.2bn / €4.2bn ≈ 0.29
or:
approximately 29% of annual structural revenue growth
This implies that, under current assumptions, the refinancing cycle alone does not exhaust the system’s annual headroom.
That is consistent with the central argument of the paper:
Ireland is not currently in immediate fiscal crisis
However, it also implies that a substantial share of annual structural revenue growth is already being absorbed by rising debt costs before any further revenue shock is introduced.
A.6 Revenue Shock Scenarios
The next step is to introduce revenue loss scenarios linked to multinational concentration and OECD-related adjustment.
From Section 3, total corporation tax revenue is estimated at approximately:
€30–35 billion
Using €30 billion as a working baseline, the following simplified scenarios can be derived:
| Scenario | Revenue Loss (ΔR) | Interest Increase (ΔI) | Total Pressure (ΔI + ΔR) | % of Structural Growth (€4.2bn) |
|---|---|---|---|---|
| Baseline | €0.0bn | €1.2bn | €1.2bn | 29% |
| Mild adjustment (-5%) | €1.5bn | €1.2bn | €2.7bn | 64% |
| Moderate adjustment (-15%) | €4.5bn | €1.2bn | €5.7bn | 136% |
| Severe adjustment (-30%) | €9.0bn | €1.2bn | €10.2bn | 243% |
| Structural unwind (-50%) | €15.0bn | €1.2bn | €16.2bn | 386% |
A.7 Interpretation of the Threshold
The threshold condition is reached when:
(ΔI + ΔR) / ΔS ≥ 1
That is, when total annual pressure exceeds the annual growth in structural revenue.
Using the working numbers above:
Constraint threshold ≈ €4.2 billion per year
This is not an arbitrary ratio. It emerges directly from:
- the estimated size of structural revenue
- the nominal growth rate of the domestic economy
- and the incremental cost of debt repricing
Under these assumptions:
- the baseline remains below the threshold
- the mild adjustment remains below the threshold, though materially tighter
- the moderate adjustment crosses the threshold
- the severe and structural unwind scenarios exceed it by a substantial margin
The result is important:
Ireland does not become constrained only when interest costs become large in absolute terms. It becomes constrained when rising debt costs and revenue erosion jointly absorb the system’s annual capacity to generate new fiscal space.
A.8 Why This Is a Better Threshold
This formulation improves on a fixed ratio threshold for three reasons.
First, it is non-arbitrary. It is derived from the structure of the Irish fiscal system rather than imported from another case.
Second, it is dynamic. It does not rely on a static interest-to-revenue number, but on the interaction between:
- debt repricing
- revenue loss
- and domestic growth capacity
Third, it is testable. Each component can be monitored over time:
- structural revenue estimates
- nominal GNI* growth
- refinancing volumes and yields
- and changes in corporation tax receipts
This allows the framework to function not only as an interpretation of current conditions, but as a monitoring tool.
A.9 Practical Reading of the Model
The practical implication is straightforward.
The Irish system retains headroom so long as:
- structural revenue continues to grow
- multinational-driven revenue does not fall materially
- and refinancing costs rise in an orderly manner
Constraint emerges when this ceases to be true.
The relevant question is therefore not:
how large is the debt stock?
but:
how much annual fiscal pressure can the system absorb before it loses the ability to respond flexibly?
Under the assumptions used here, that boundary is approximately:
€4 billion per year of combined pressure
That figure should not be interpreted as a prediction of crisis. It is better understood as a structural boundary beyond which the system’s discretionary capacity begins to disappear.
A.10 Conclusion
The Irish case suggests that debt sustainability is best understood not through a single debt ratio or a single interest ratio, but through a flow condition:
constraint binds when the combined effect of rising debt costs and declining reliable revenue exceeds the annual growth in structural revenue
This result generalises the earlier framework.
In systems with stable revenue, interest dynamics dominate.
In systems where revenue contains a large external or unstable component, the relevant variable becomes:
interest relative to reliable revenue growth
That is the threshold derived in this appendix.
Final Summary: The Ireland Fiscal Monitoring Signal
📍 The Key Takeaway: The €4 Billion Boundary
The structural stability of the Irish State is not defined by its total debt, but by its Annual Headroom.
The Model Threshold: The Irish fiscal system reaches its operational limit when the combined annual pressure from rising interest costs and revenue erosion exceeds €4.2 Billion.
- Baseline Pressure: Currently ~€1.2 Billion (driven by the 2026 debt repricing cycle).
- The Risk Zone: A loss of just €3 Billion in multinational-driven revenue (a ~10% corporate tax shock) would push the system to the €4.2 Billion structural boundary.
The Verdict: Beyond this boundary, the State loses its “Power to Act.” Any further shocks—be they fuel price spikes or infrastructure needs can no longer be absorbed by growth and must instead be funded by direct cuts to existing services or emergency borrowing.
Appendix B: Methodology – AI-Assisted Iterative Analysis
B.1 Overview
This paper is the result of an AI-assisted, iterative reasoning process, not a single-pass analysis.
The objective was not to generate content, but to:
develop a structurally consistent, data-grounded model through recursive interrogation and validation
The process combined:
- human-led hypothesis formation
- multi-model AI interrogation
- constraint-based reasoning
- external data validation
and evolved through repeated refinement cycles.
B.2 Core Principle: From Narrative to Model
At the outset, the analysis resembled a conventional blog post:
- descriptive
- narrative-driven
- partially opinionated
Through iteration, it transitioned into:
a model-driven analysis with explicit assumptions and testable conditions
This transformation did not occur in a single step.
It emerged through progressive constraint and correction, where AI systems:
- rejected weak framing
- exposed inconsistencies
- and forced alignment with data
B.3 The Recursive Interrogation Framework
The process followed a structured loop:
Observe → Question → Decompose → Model → Stress → Validate → Synthesize
This loop was executed dozens of times across multiple AI systems.
Stage 1: Observation (The Inconsistency)
The analysis began with a contradiction:
Ireland appeared fiscally strong (surpluses, growth), yet exhibited visible strain (fuel protests, sectoral pressure).
This created the core question:
Why does a system with apparent surplus show signs of constraint?
Stage 2: Decomposition
AI was used to break the system into components:
- measurement (GDP vs GNI*)
- revenue composition (multinational concentration)
- debt structure (stock vs refinancing)
- cost dynamics (interest rate regime shift)
- expenditure rigidity
At this stage, AI acted as:
a decomposition engine rather than a conclusion generator
Stage 3: Iterative Model Refinement
This was the most critical phase.
A provisional model was repeatedly:
- proposed
- challenged
- revised
Example progression:
| Iteration | Model | Outcome |
|---|---|---|
| 1 | Ireland has a debt problem | Rejected — metrics appear strong |
| 2 | GDP is distorted | True but insufficient |
| 3 | Revenue is concentrated | Static explanation |
| 4 | Debt is being repriced | Adds cost dimension |
| 5 | Revenue ↓ + Cost ↑ | Still incomplete |
| 6 | Interaction of both → constraint | Final model emerges |
🔥 Critical Insight: AI-Enhanced Course Correction
At multiple points, the analysis diverged or stalled:
- the Irish system initially appeared too strong to analyse
- the model risked becoming a duplicate of the U.S. framework
- early drafts drifted toward opinion or political framing
AI systems played a key corrective role by:
- rejecting unsupported claims
- highlighting inconsistencies
- forcing return to measurable variables
This process can be described as “AI-enhanced thinking”: the inability to see structural flaws was resolved through iterative AI-guided interrogation.
B.4 Multi-Model Cross-Validation (Synthetic Reasoning)
The analysis was conducted across multiple AI systems, including:
- DeepSeek (logical stress-testing, structural critique)
- Gemini (summary refinement, visual modelling)
- ChatGPT (synthesis, consistency, formalisation)
- Qwen (derivation, reframing, optimisation)
Each system provided distinct analytical strengths:
| System | Strength |
|---|---|
| DeepSeek | Aggressive logical critique, model tightening |
| Gemini | Clarity, structure, visualisation |
| ChatGPT | Synthesis, coherence, formalisation |
| Qwen | First-principles derivation, constraint reframing, structural optimisation |
Rather than seeking agreement, the process used:
divergence as a signal
When models disagreed:
- assumptions were re-examined
- data was re-checked
- the model was refined
This created a form of:
synthetic reasoning across independent systems
B.5 Data Anchoring and Constraint Enforcement
To prevent drift into abstraction:
AI outputs were constrained using:
- forced metrics (e.g. GNI* instead of GDP)
- explicit segmentation (windfall vs structural revenue)
- real-world constraints (NTMA refinancing schedules, PBO deficits)
AI was not allowed to choose the data context — it was forced to operate within it.
All major claims were validated against:
- CSO
- NTMA
- Parliamentary Budget Office
- Department of Finance
- Irish Fiscal Advisory Council
B.6 The Quality Amplification Process
A key feature of this methodology is that quality improved in discrete steps, not continuously.
Each stage of refinement produced a measurable increase in clarity and rigor:
| Stage | Effect |
|---|---|
| Initial draft | Narrative, partially unstructured |
| Iterative rewrite | Improved logic, reduced bias |
| Paper-style restructuring | Significant clarity gain |
| Multi-pass rewriting | Internal consistency improved |
| Visualisation (graphs/diagrams) | Conceptual clarity increased |
| Data grounding (sources) | Credibility increased |
| Model definition | Analytical power increased significantly |
🔥 Key Observation
The largest improvement occurred when the analysis shifted from description to model definition.
B.7 Model Discovery vs Model Application
An important turning point occurred when:
- the Irish case was initially treated as a direct extension of the U.S. model
- this assumption failed under analysis
Result:
The Irish system required a different formulation
From:
Interest / Revenue
To:
Interest / Reliable Revenue
This transition represents:
model discovery rather than model application
B.8 Editorial Constraint and Bias Reduction
AI systems played an active role in:
- removing unsupported sections (e.g. demographics, speculative elements)
- discouraging political framing
- enforcing neutrality in discussion of protests and policy
This resulted in:
- removal of low-signal content
- increased analytical clarity
- improved tone consistency
Example Adjustments
- Demographic analysis removed (low impact on core model)
- Future Ireland Fund de-emphasised (secondary effect)
- Protest narrative reframed from advocacy → signal
B.9 Synthetic Threshold Development
The final model produced a derived constraint condition:
Δ Interest + Δ Revenue ≥ System Adjustment Capacity
This was further operationalised as:
~€4.2 billion annual pressure boundary
This value was not sourced directly, but synthesised by:
- combining NTMA refinancing data
- PBO deficit estimates
- corporate tax sensitivity
This represents a synthetic output: a model-derived boundary rather than a reported statistic.
B.10 Reproducibility
This process can be replicated by following:
- Start with a real-world inconsistency
- Decompose into measurable components
- Iterate until the model stabilises
- Cross-check across multiple AI systems
- Anchor all claims in primary data
- Identify a testable constraint condition
The key requirement is:
discipline in questioning, not reliance on any single AI output
B.11 Limitations
- AI systems do not provide verified facts
- Iteration can reinforce bias without adversarial testing
- Model outputs depend on input framing
- Synthetic results require careful interpretation
AI does not eliminate uncertainty. It makes the structure of that uncertainty visible.
B.12 Conclusion
This methodology demonstrates a shift from:
- AI as a writing tool to
- AI as a structured reasoning partner
The contribution of this paper is therefore twofold:
- A model of Irish fiscal constraint
- A reproducible framework for AI-assisted system analysis
The analysis is not the output of AI. It is the result of a process in which AI made flawed reasoning increasingly difficult to sustain.
Appendix B Diagram: AI-Assisted Iterative Reasoning Process
    flowchart LR
    %% Styles
    classDef observe fill:#e3f2fd,stroke:#1565c0,stroke-width:2px,color:#0d47a1
    classDef decompose fill:#e8f5e9,stroke:#2e7d32,stroke-width:2px,color:#1b5e20
    classDef iterate fill:#fff3e0,stroke:#ef6c00,stroke-width:2px,color:#e65100
    classDef validate fill:#f3e5f5,stroke:#6a1b9a,stroke-width:2px,color:#4a148c
    classDef output fill:#ffebee,stroke:#c62828,stroke-width:2px,color:#b71c1c

    A["Observed Inconsistency<br/>Headline strength vs visible strain"] --> B["Initial Question Formation"]
    B --> C["System Decomposition<br/>Measurement / Revenue / Debt / Spending"]
    C --> D["Provisional Model"]
    D --> E["AI Interrogation<br/>Challenge assumptions / identify gaps"]
    E --> F["Cross-Model Review<br/>DeepSeek / Gemini / ChatGPT"]
    F --> G["External Validation<br/>CSO / NTMA / PBO / DoF"]
    G --> H["Model Revision"]
    H --> I{"Stable and<br/>internally consistent?"}

    I -- No --> D
    I -- Yes --> J["Synthesis"]
    J --> K["Formal Model<br/>Interest / Reliable Revenue"]
    K --> L["Derived Constraint Boundary<br/>~€4.2bn annual pressure"]

    class A,B observe
    class C,D decompose
    class E,F,H,I iterate
    class G,J validate
    class K,L output
This process did not use AI to generate conclusions directly. It used AI to repeatedly challenge, refine, and validate provisional explanations until a structurally consistent model emerged.
📚 Suggested Citation
Ernan Hughes. (2026). From Fuel Protests to Fiscal Risk: What’s Really Happening in Ireland.
Available at: https://programmer.ie/post/irish_debt/
Version: 1.0
Date: April 2026
⚖️ License
This document is intended as a working paper and may be updated as new data or assumptions evolve.
This work is licensed under the Creative Commons Attribution-NonCommercial 4.0 International License (CC BY-NC 4.0).
You are free to:
- Share — copy and redistribute the material in any medium or format
- Adapt — remix, transform, and build upon the material
Under the following terms:
- Attribution — You must give appropriate credit
- NonCommercial — You may not use the material for commercial purposes
Full license: https://creativecommons.org/licenses/by-nc/4.0/