SIS: The Visual Dashboard That Makes Stephanie's AI Understandable

🔍 The Invisible AI Problem
How do you debug a system that generates thousands of database entries, hundreds of prompts, and dozens of knowledge artifacts for a single query?
SIS is our answer a visual dashboard that transforms Stephanie’s complex internal processes into something developers can actually understand and improve.
📰 In This Post
I
- 🔎 See how Stephanie pipelines really work – from Arxiv search to cartridges, step by step.
- 📜 View logs and pipeline steps clearly – no more digging through raw DB entries.
- 📝 Generate dynamic reports from pipeline runs – structured outputs you can actually use.
- 🤖 Use pipelines to train the system – showing how runs feed back into learning.
- 🧩 Turn raw data into functional knowledge – cartridges, scores, and reasoning traces.
- 🔄 Move from fixed pipelines toward self-learning – what it takes to make the system teach itself.
- 🖥️ SIS isn’t just a pretty GUI - it’s the layer that makes Stephanie’s knowledge visible and usable.
- 🈸️ Configuring Stephanie – We will show you how to get up and running with Stephanie.
- 💡 What we learned – the big takeaway: knowledge without direction is just documentation.
❓ Why We Built SIS
When you’re developing a self-improving AI like Stephanie, the real challenge isn’t just running pipelines it’s making sense of the flood of logs, evaluations, and scores the system generates.
SIS (Stephanie Insight System) is our answer:
- A dashboard viewer that surfaces pipeline runs, evaluations, prompts, and scores.
- Built with FastAPI, Jinja2, and Gradio.
- Backed by Postgres (for Stephanie’s state) and SQLite (for quick insight snapshots).
- Designed for developers who need to debug, trace, and improve Stephanie at a glance.
No
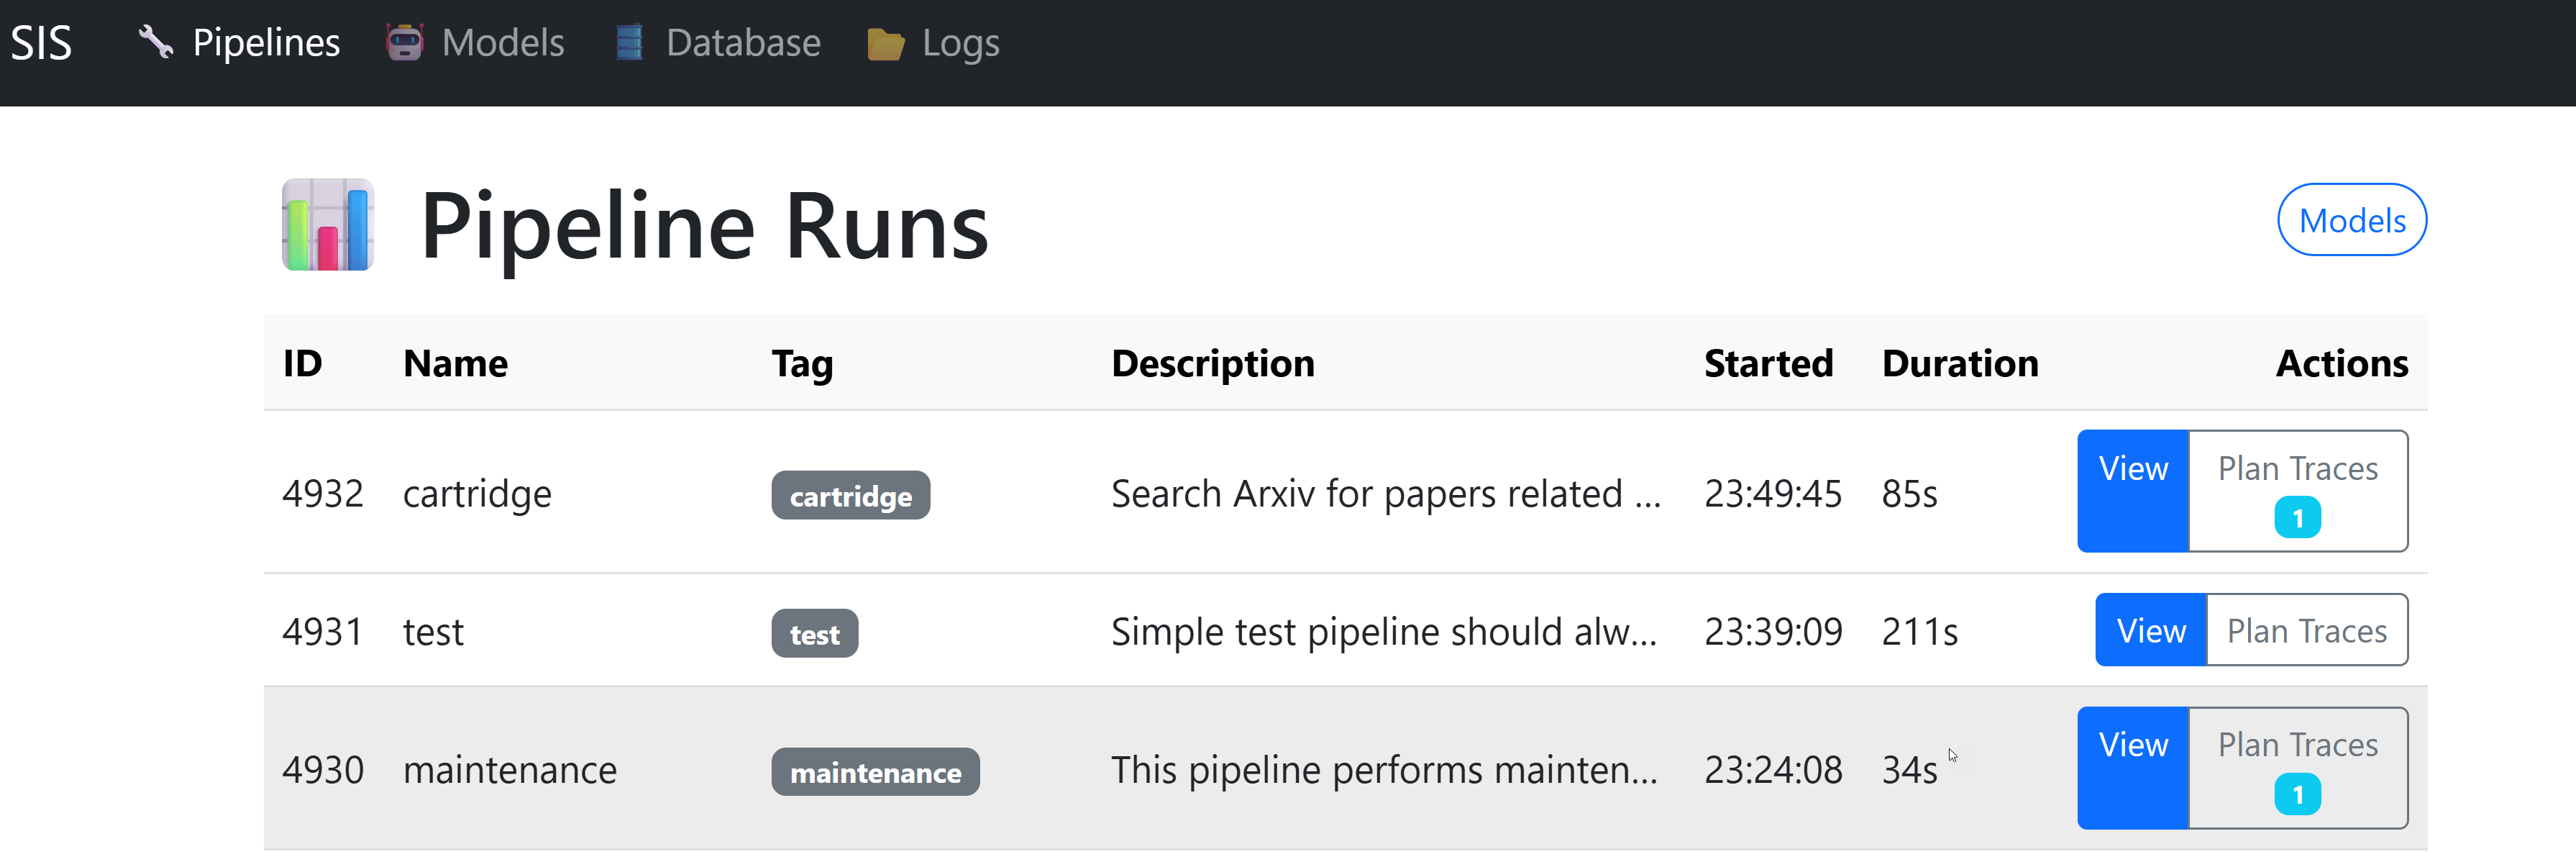 The SIS main dashboard showing recent pipeline runs, their status, and key metrics. The color-coded stages make it easy to spot bottlenecks at a glance.
🧪 Case Study: The Cartridge Pipeline
To make SIS concrete, we’ll use one pipeline as our running example: the Cartridge Pipeline.
This pipeline takes a high-level goal (like “build an AI that continually learns from its own results”) and transforms it into structured, reusable knowledge units called cartridges and sometimes theorems. It’s defined in config/cartridge.yaml and represents a complete cycle of:
- Searching → finding relevant papers on Arxiv.
- Processing → loading, summarizing, and profiling them.
- Scoring → evaluating their relevance and quality.
- Synthesizing → distilling them into cartridges.
- Reasoning → using those cartridges in context to reflect on the original goal.
What matters isn’t memorizing each stage, but realizing what this pipeline produces: a flood of artifacts that can be hard to understand without a viewer. That’s where SIS comes in.
⚖️ The Three Pillars of Output (And How SIS Helps)
Running the cartridge pipeline produces three kinds of outputs that SIS is designed to capture and present:
-
🧠 Plan Traces – step-by-step execution logs showing exactly how the pipeline ran. These reveal agent transitions, timings, and decisions. SIS uses Mermaid.js diagrams to visualize them, turning opaque logs into interactive flowcharts.
-
📝 Reports – the human-readable narrative artifact of a run. Reports combine the goal, stages, extracted knowledge, cartridges, and theorems into one Markdown file. This is where “execution” crystallizes into knowledge. SIS surfaces reports directly in the UI (and lets you download them).
-
📜 Logs & Context – the raw JSONL/YAML traces with every prompt, response, and config. Essential for deep debugging, but overwhelming without structure. SIS points to these logs, giving you access when you need the unfiltered truth.
Beyond that, SIS also makes visible:
- the documents a run consumed,
- the scores generated by different evaluators (MRQ, SICQL, EBT, HRM, etc.), and
- the resulting cartridges and theorems.
By focusing on the cartridge pipeline in this post, we get a clear example of SIS’s purpose: to turn the sprawling, messy outputs of a complex AI system into something navigable and insightful.
Without SIS, a pipeline run is just logs and tables hard to piece together, harder to learn from. With SIS, it becomes a story you can follow: plan traces, reports, scores, and cartridges all lined up so you can understand, tune, leverage, and build upon what Stephanie produces.
    flowchart LR
    %% Styles
    classDef search fill:#3182ce,stroke:#fff,stroke-width:2px,color:#fff
    classDef process fill:#2b6cb0,stroke:#fff,stroke-width:2px,color:#fff
    classDef score fill:#38a169,stroke:#fff,stroke-width:2px,color:#fff
    classDef knowledge fill:#d69e2e,stroke:#fff,stroke-width:2px,color:#fff
    classDef synth fill:#dd6b20,stroke:#fff,stroke-width:2px,color:#fff
    classDef reason fill:#805ad5,stroke:#fff,stroke-width:2px,color:#fff

    %% Nodes
    A["🔎 Arxiv Search<br/><i>find papers</i>"]:::search
    B["📥 Document Loader<br/><i>fetch & summarize</i>"]:::process
    C["🧩 Document Profiler<br/><i>extract key sections</i>"]:::process
    D["📊 Paper Scorer<br/><i>evaluate quality</i>"]:::score
    E["📚 Knowledge Loader<br/><i>ingest knowledge</i>"]:::knowledge
    F["🗄️ Knowledge DB Loader<br/><i>reload from DB</i>"]:::knowledge
    G["📦 Cartridge Generator<br/><i>distill into cartridges</i>"]:::synth
    H["🧠 ICL Reasoning<br/><i>reason over cartridges</i>"]:::reason

    %% Flow
    A --> B --> C --> D --> E --> F --> G --> H
🎨 Design Philosophy
One of the hardest design problems we faced with SIS was where to draw the boundary.
On the one hand, we needed a tool that could show us everything Stephanie was doing pipeline runs, documents, evaluations, scores. On the other hand, we didn’t want the dashboard to dictate how Stephanie works.
That meant SIS had to sit outside the application. It listens in, it displays, it organizes but it doesn’t drive the system. If Stephanie changes, SIS should still work with minimal effort. If SIS changes, Stephanie should keep running the way it always has.
In practice, this meant:
- No tight coupling: SIS queries the same database and logs, but doesn’t define how pipelines execute.
- Complement, not control: SIS is for human understanding, not for steering the AI.
- Flexibility first: as we evolve Stephanie into a self-improving pipeline-driven system, SIS remains a viewer a way to look inside from the outside.
That’s the balance: Stephanie is the engine, the algorithms, the pipelines. SIS is the window. If we ever let SIS wire Hey Cortana I need my lunch can you bring me up the cheese bring me up some onion Can you bring me up an apple and can you bring me up and can you also bring me up some some some Arrow OK what you want to drink All right OK all right bring it up now Yes please Yeah I know I know i’ve used sport problem Yeah that’s right squares OK thank you very much all right I could a lot of sugar in that alright let’s go all right itself into the engine, we’d risk losing the flexibility that makes Stephanie powerful in the first place.
    flowchart LR
    subgraph Stephanie["Stephanie (AI System)"]
        P1["Pipelines (Arxiv → Cartridges → ICL)"]
        A1["Algorithms (MRQ, EBT, SVM, HRM)"]
        DB[(Database + Logs)]
        P1 --> DB
        A1 --> DB
    end

    subgraph SIS["SIS (Dashboard Viewer)"]
        V1["📊 Pipelines View"]
        V2["📑 Reports & Scores"]
        V3["📂 Database Explorer"]
        DB --> V1
        DB --> V2
        DB --> V3
    end

    classDef core fill:#2b6cb0,stroke:#fff,stroke-width:1px,color:#fff
    classDef viewer fill:#2f855a,stroke:#fff,stroke-width:1px,color:#fff

    class Stephanie core
    class SIS viewer
🚦 Getting Started
Assuming you have pgvector installed. Check this blog post: PostgreSQL for AI: Storing and Searching Embeddings with pgvector for instructions.
You will also need to load the schema.sql file into a database (co).
🔮 In a future blog post we aim to remove this requirement from stephanie.
# clone the repo
git clone https://github.com/ernanhughes/stephanie.git

# install required libraries
pip install -r .\requirements.txt
pip install -r .\requirements_sis.txt

# will create the models, ingest 100 docs to train on
python -m stephanie.main --config-name maintenance

# this is what we will cover in this blog post
python -m stephanie.main --config-name cartridge

# start sis
uvicorn sis.main:app --reload
Or, if you’ve set up the __main__.py, simply:
python -m sis
You can then open a browser to view SIS
As you run pipelines you will get more entries to view.
python -m stephanie.main --config-name scorer
⚙️ Configuration
Config lives in sis/config/config.yaml:
# Which log files to display in the logs view
logs:
  dir: "logs"     # absolute or relative path
  max_files: 500     # optional: limit how many files to show in UI
  extensions: [".log", ".jsonl", ".yaml"]  # optional: restrict what shows

# Database connection (for MemoryTool and ORM stuff)
db:
  name: "co"
  user: "co"
  password: "****"
  host: "localhost"
  port: 5432

# API service (FastAPI/uvicorn)
api:
  host: "0.0.0.0"
  port: 8000
  reload: true

# Logging
logging:
  level: "INFO"
  file: "sis.log"
That’s where you map SIS to your Stephanie database and adjust the dashboard.
🏯 Architecture Walkthrough
🍎 1. FastAPI Core
The entrypoint is main.py:
cfg = load_config()
logger = JSONLogger("logs/sis.jsonl")      # JSON log file for SIS events
memory = MemoryTool(cfg=cfg, logger=logger)  # Unified database/memory layer

# Initialize FastAPI app
app = FastAPI(title="Stephanie Insight System (SIS)")

# Store global objects in app.state for easy access in routes
app.state.memory = memory
app.state.templates = Jinja2Templates(directory="sis/templates")
app.state.templates.env.globals["now"] = datetime.now  # inject 'now' into templates
app.state.templates.env.filters["datetimeformat"] = datetimeformat  # add custom filter
app.state.config = cfg  # make config globally available in routes
We use app.state to share MemoryTool and templates across routers.
👣 2. Pipelines Router
Pipelines are the heart of Stephanie. We expose routes to:
- List runs (
/) - View details (
/pipeline/{id}) - Drill into scores, documents, reports
Example from routes/pipelines.py:
@router.get("/", response_class=HTMLResponse)
def list_pipelines(request: Request):
    runs = request.app.state.memory.pipeline_runs.get_all(limit=50)
    return templates.TemplateResponse(
        "pipelines.html",
        {"request": request, "runs": runs}
    )

@router.get("/pipeline/{pipeline_id}", response_class=HTMLResponse)
def pipeline_detail(request: Request, pipeline_id: int):
    memory = request.app.state.memory
    run = memory.pipeline_runs.get_by_run_id(pipeline_id)
    prompts = memory.prompt.get_by_run_id(pipeline_id)
    evaluations = memory.evaluations.get_by_run_id(pipeline_id)
    documents = memory.pipeline_references.get_documents_by_run_id(pipeline_id, memory, limit=100)
    report = memory.reports.get_content(run.id)

    return templates.TemplateResponse(
        "pipeline_detail.html",
        {"request": request, "run": run, "prompts": prompts,
         "evaluations": evaluations, "documents": documents, "report": report}
    )
🧐 Pipeline Details
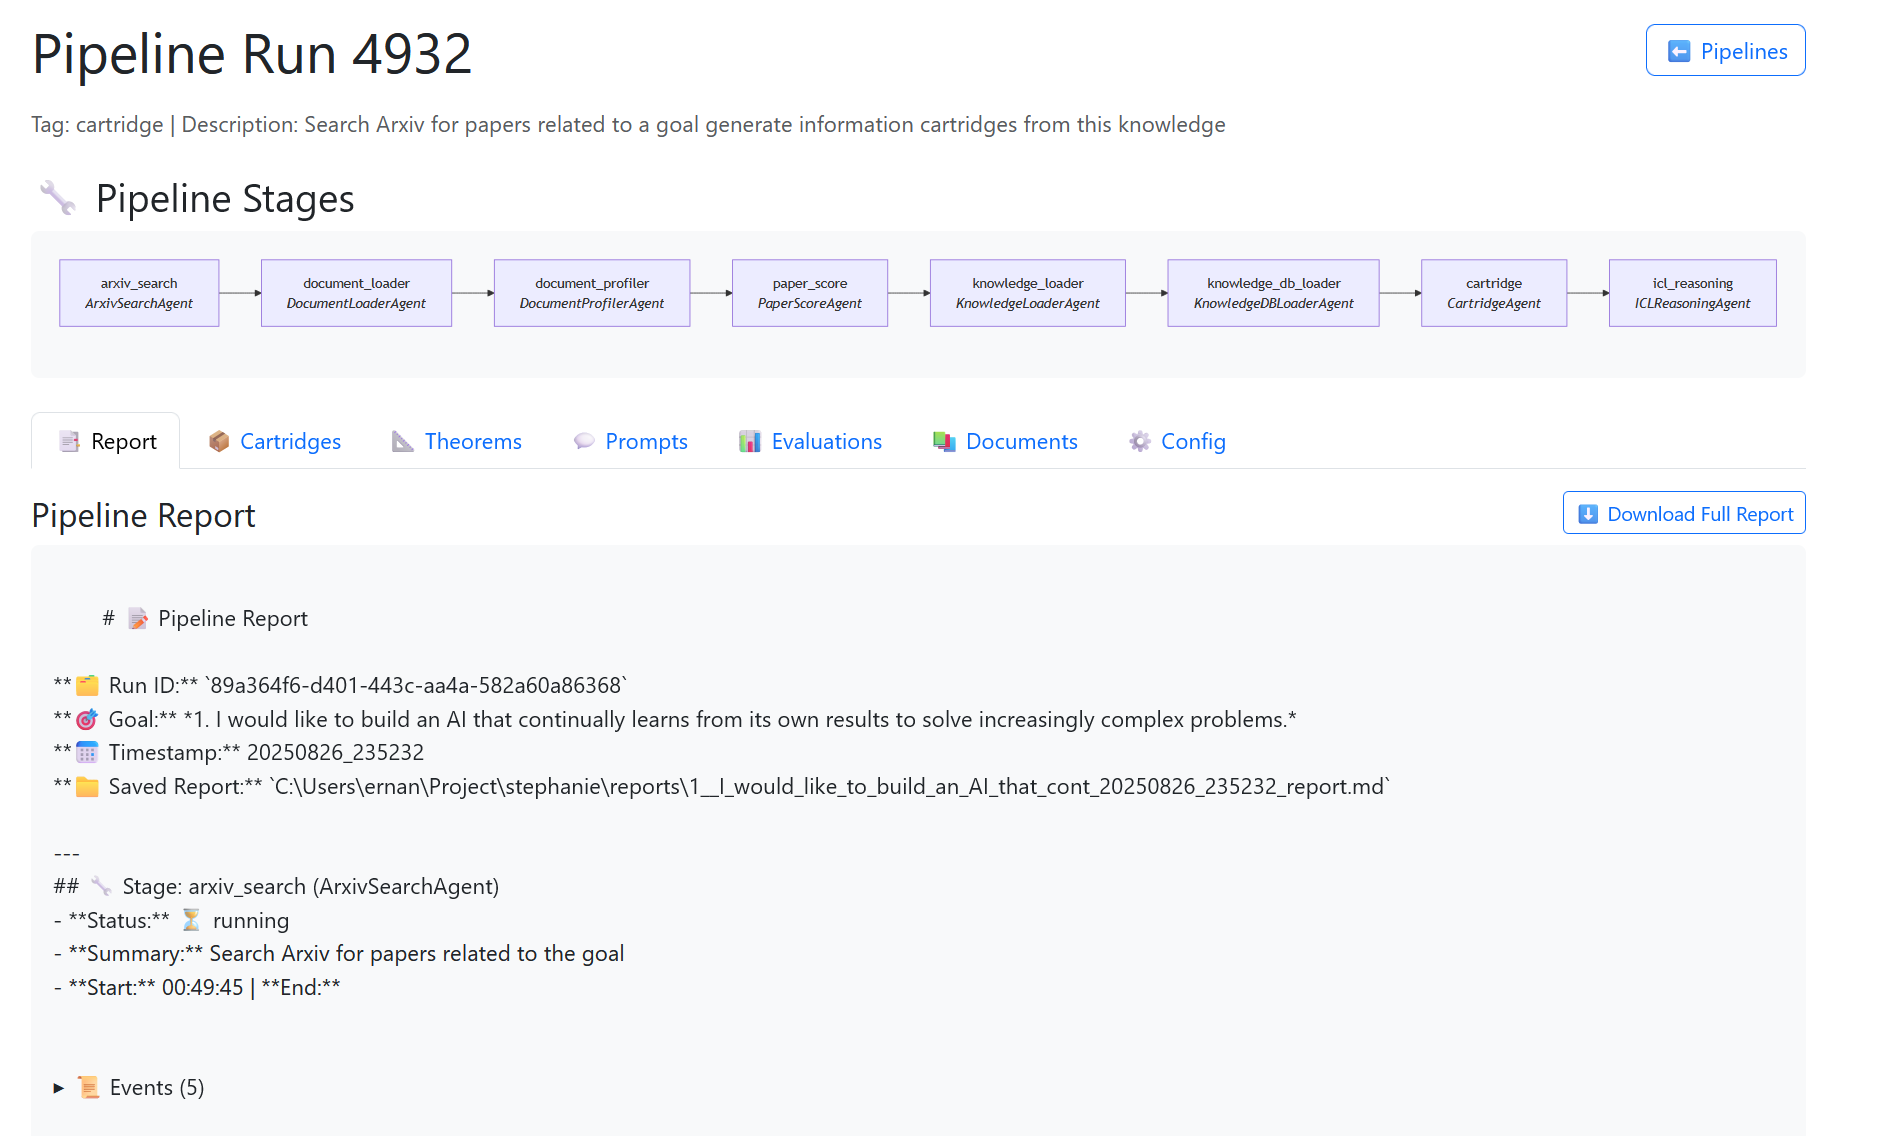
The Pipeline Details page is the heart of the SIS dashboard. It provides a complete view of a single pipeline run, from its stages and outputs to the documents and theorems it produced.
👁️🗨️ Visualizing Pipelines with Mermaid
One of the nicest effects we added to the SIS plan trace view is a dynamic Mermaid.js diagram. Instead of staring at raw YAML or table rows, you can actually see how the pipeline flows from stage to stage.
The template snippet is simple:
<pre class="mermaid">
flowchart LR
{% for stage in stages %}
  {% set short_class = stage.agent_class.split('.')[-1] if stage.agent_class else "Unknown" %}
  S{{ stage.id }}["{{ stage.stage_name }}<br/><i>{{ short_class }}</i>"]

  {% if not loop.last %}
    S{{ stage.id }} --> S{{ stages[loop.index].id }}
  {% endif %}
{% endfor %}
</pre>
And at the bottom of the page we drop in Mermaid support:
<script type="module">
  import mermaid from "https://cdn.jsdelivr.net/npm/mermaid@11.10.1/dist/mermaid.esm.min.mjs";
  mermaid.initialize({ startOnLoad: true });
</script>
The result is a clean, interactive diagram that makes the pipeline structure obvious at a glance:
This makes debugging pipelines easier. You can click stages, see their configs, and instantly understand how one stage feeds the next. It turned “rows in a log” into a process you can reason about visually.
We intend to enhance this to allow rerunning stages, viewing configs changing parameters etc.
🔄 Stages
Every pipeline is made up of stages each stage corresponds to an agent (e.g., hypothesis generator, judge, scorer). On this page, you can see:
- The order of execution
- Which agents were used
- How long each stage took
- Whether it succeeded or failed
This makes it easy to spot bottlenecks or errors in the workflow.
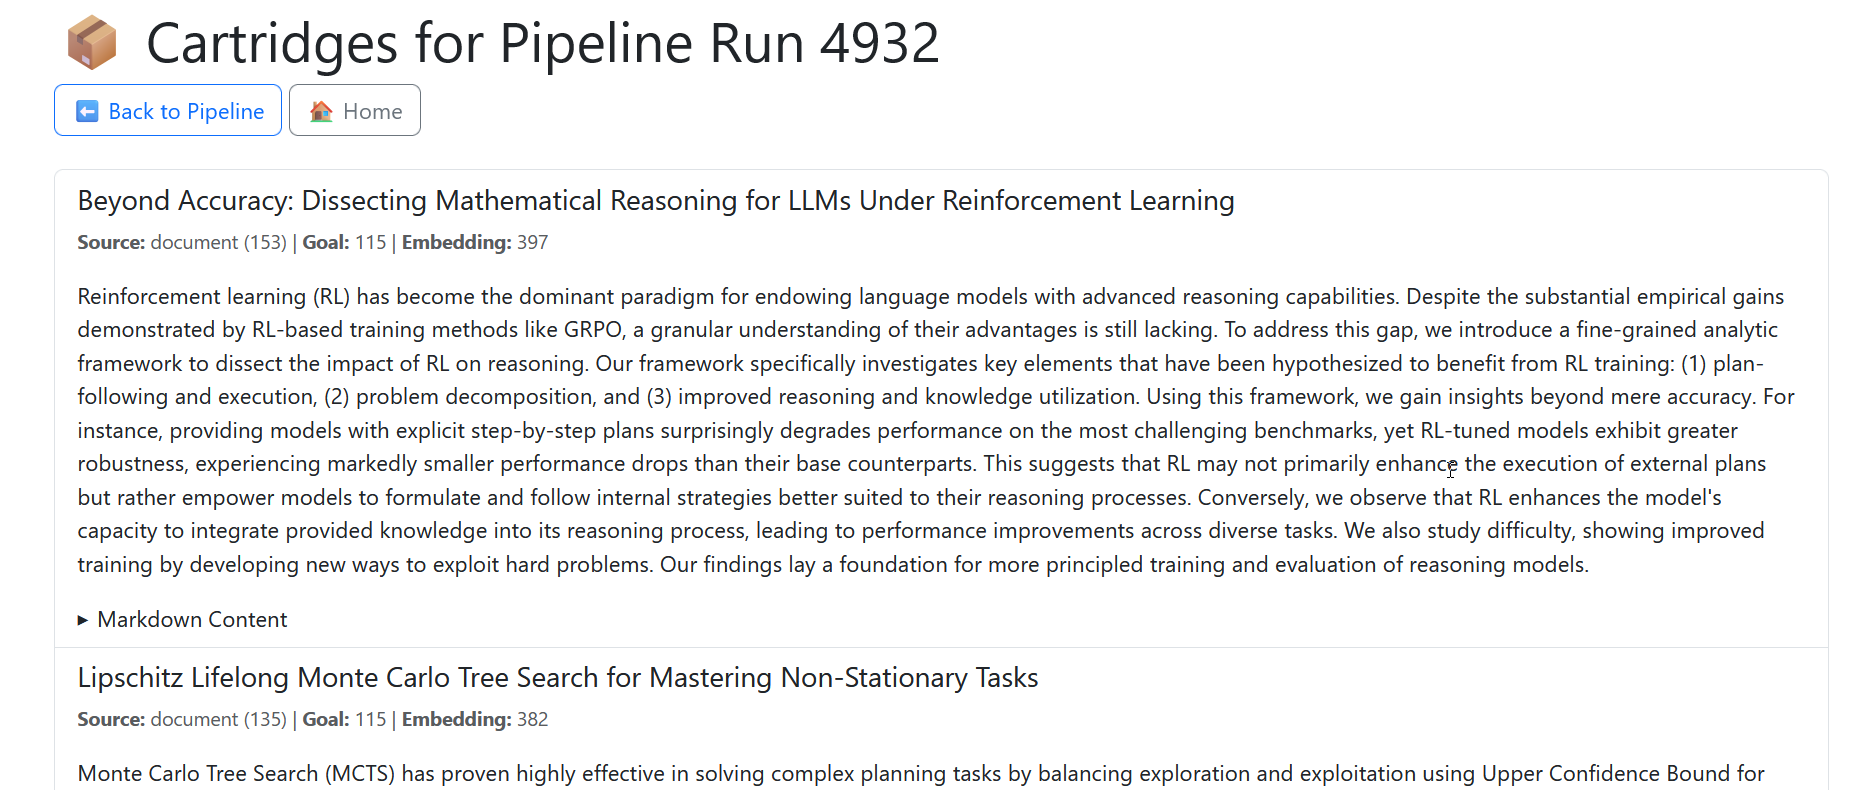
📦 Cartridges
Cartridges are units of distilled knowledge created from documents, prompts, or reasoning steps. On this page you can see all cartridges linked to a run, allowing you to:
- Inspect what knowledge was extracted
- Check how it was scored and classified
- Reuse cartridges for future reasoning
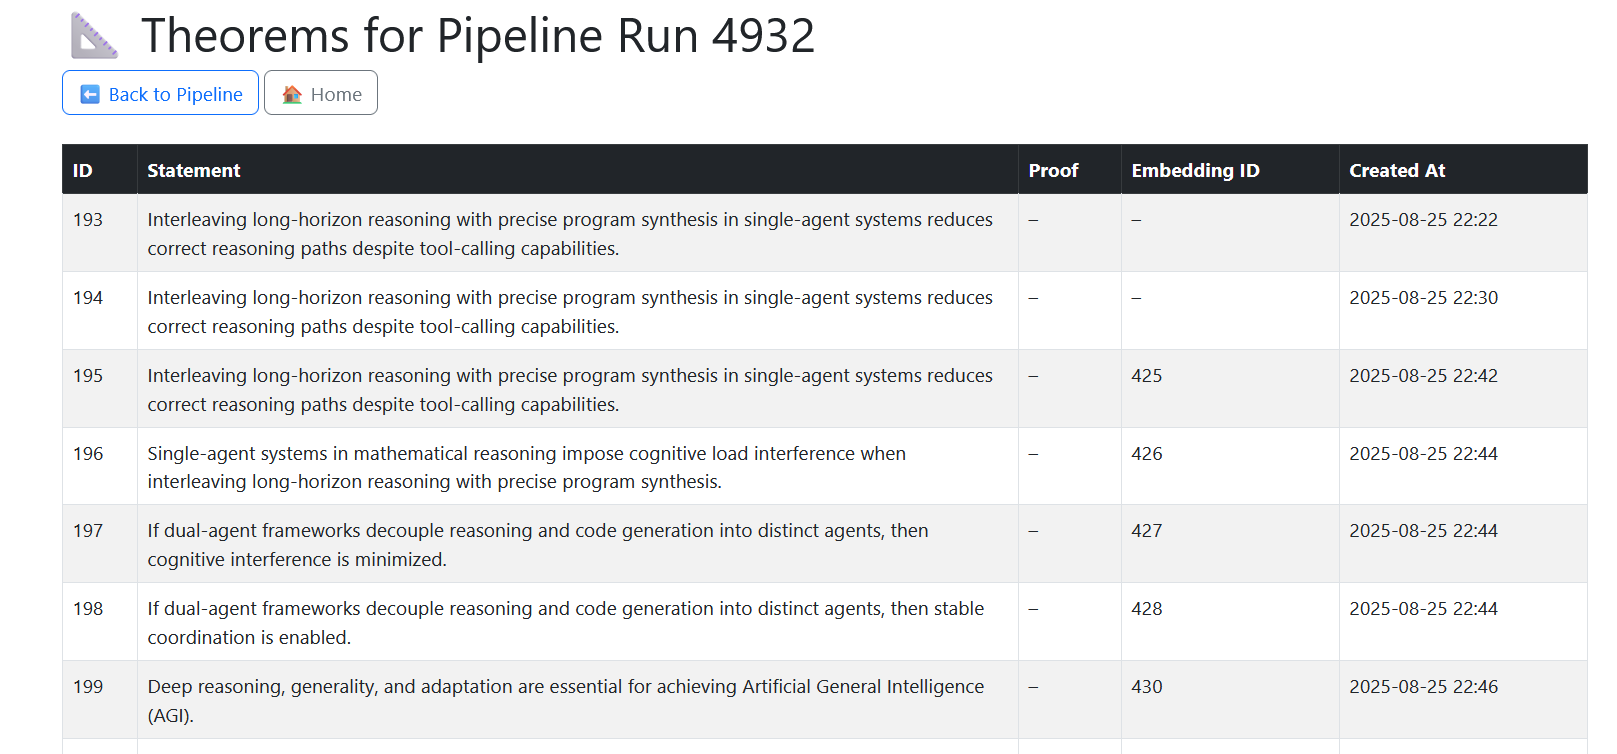
🔮 Theorems
Theorems are Stephanie’s way of capturing reusable reasoning patterns. Here you can explore any theorems generated during the run:
- Formalized statements Stephanie has derived
- Their supporting evidence
- Potential links to future problem-solving
💬 Prompts
Prompts drive each stage of reasoning. The page shows:
- Which prompts were used
- How they were rendered with context
- Links to the corresponding responses
This is essential for debugging and for iterating on better prompting strategies.

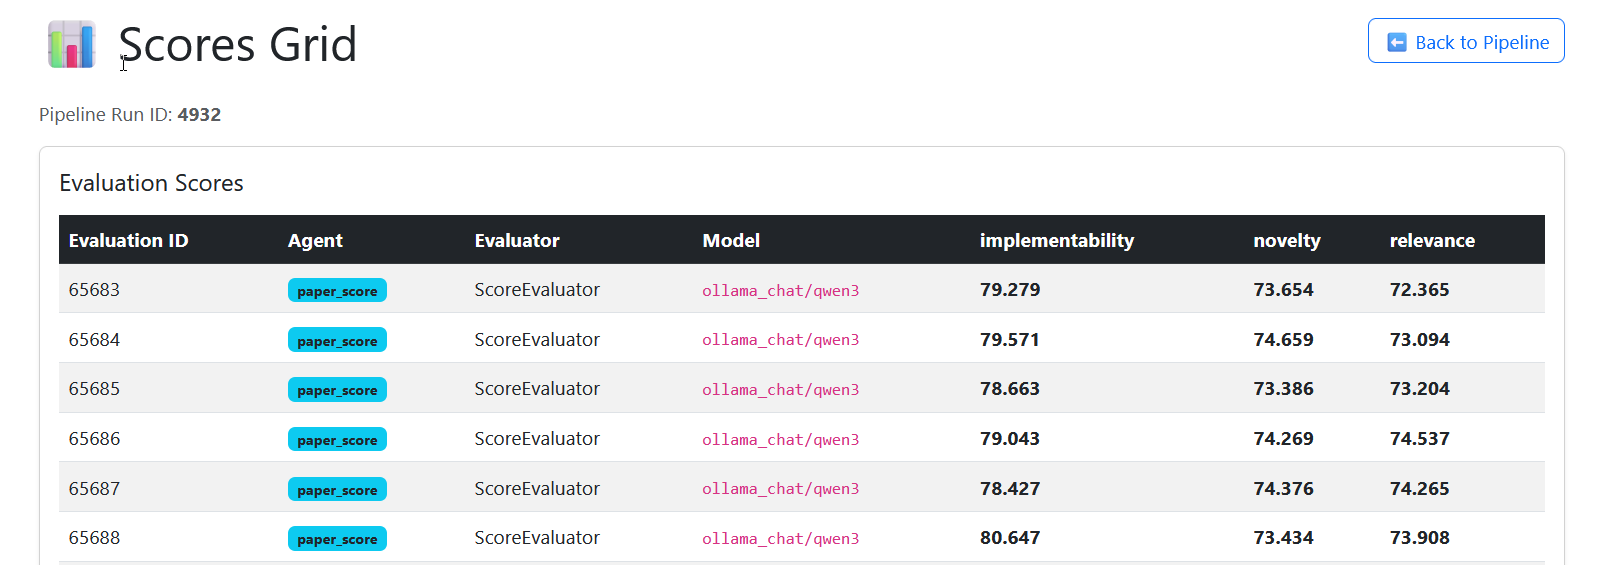
🎯 Evaluations
Evaluations show how candidate outputs were scored.
- Every evaluation links to one or more scoring dimensions (e.g., correctness, relevance, novelty)
- You can see dimension-level scores and compare across candidates
- Helps understand why one result was chosen over another
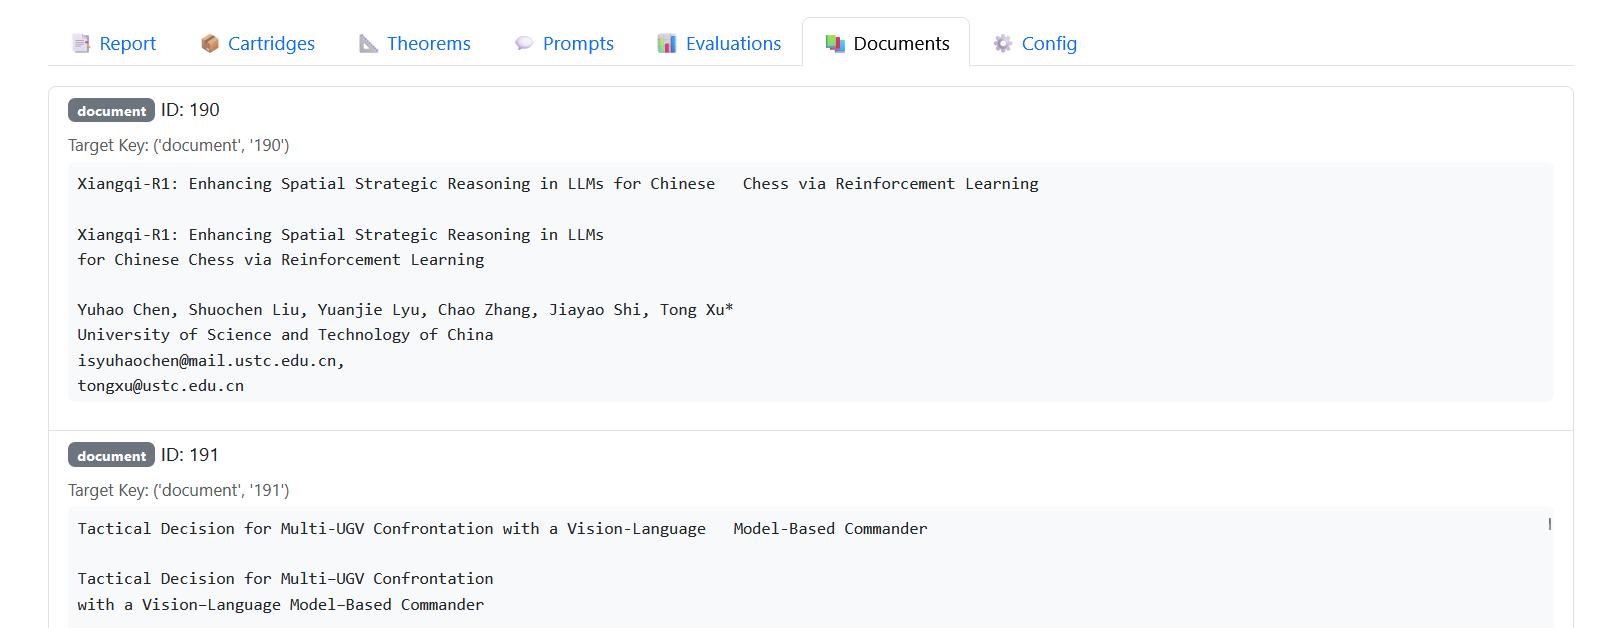
📚 Documents
Documents referenced during the pipeline run are also visible.
- Shows the top N documents retrieved or used
- Lets you trace where Stephanie’s knowledge came from
- Critical for explainability and auditing
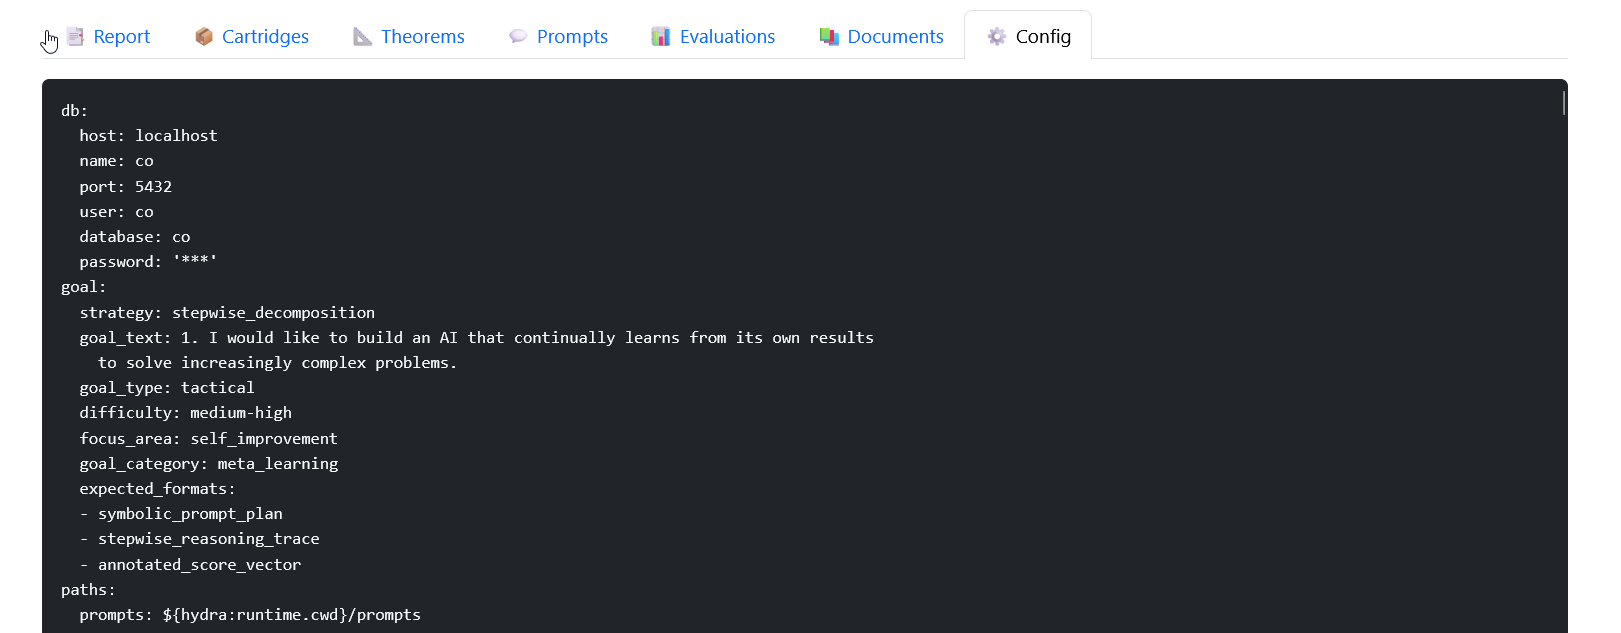
⚙️ Config
Finally, you can view the configuration that defined the run.
- The YAML snapshot of model, pipeline, and agent settings
- Makes runs reproducible
- Provides a baseline for experimentation (e.g., tweaking number of candidates, changing scorers)
👉 Together, these sections give you a full audit trail: from raw documents to structured reasoning, and finally into distilled knowledge (cartridges, theorems, reports).
flowchart TD
    A[🚀 Pipeline Run] --> B[🔄 Stages]
    B --> C[💬 Prompts]
    B --> D[📚 Documents]
    B --> E[🎯 Evaluations]
    E --> F[📦 Cartridges]
    F --> G[🔮 Theorems]
    A --> H[📝 Report]
    A --> I[⚙️ Config]

    %% Final Output
    H --> J[[✅ Final Output]]
    G --> J
📑 The Report: Turning Raw Events into Knowledge
Every pipeline Stephanie runs is noisy under the hood: dozens of agents, hundreds of intermediate outputs, streams of scores, context merges, symbolic rules applied, etc. Left unstructured, this would just be overwhelming logs.
The Report is where all of this comes together into a single narrative artifact:
- A human-readable summary of what happened in the pipeline.
- A machine-usable record that can be stored, scored, and compared later.
- The primary interface for self-improvement, since it condenses raw execution into a coherent story.
🔨 How Reports Are Built
-
Events Logged
-
Every agent and stage emits structured
report()events:- candidates generated
- pairwise eval
- hypothesis saved
- patterns classified
-
These are collected alongside pipeline-level events (start, end, errors, timings).
-
-
Pipeline Stage Summaries
-
The Supervisor tracks stage-level details:
- Which agent ran, when it started, when it ended.
- Iterations, config applied, symbolic rules.
-
-
Plan Trace + Execution Steps
- For every stage, the Plan Trace Monitor records an execution step.
- These steps link back to the same events, ensuring the report aligns with the execution trace.
-
Formatting into a Report
-
The ReportFormatter takes all this structured data and converts it into a readable Markdown document:
- Pipeline overview (goal, stages, duration, config snapshot).
- Stage-by-stage breakdown.
- Key outputs (best hypothesis, scores, final answer).
- Links to related artifacts (documents, cartridges, theorems).
-
This is a section from the cartridge agent showing where we generate a report section
    # 3. Extract Theorems
    theorems = self.theorem_extractor.extract(cartridge.sections, context)
    self.report({
        "event": "theorems_extracted",
        "step": "CartridgeAgent",
        "cartridge_id": cartridge.id,
        "theorem_count": len(theorems),
        "examples": [t.statement[:80] for t in theorems[:2]],
    })
This will then show up in the report as follows
- **theorems_extracted**: Examples: ['Semifactual explanations for reinforcement learning enable understanding of deci', 'SGRL-Rewind and SGRL-Advance are the first algorithms designed to generate semif']...
🗝️ Why Reports Are Critical
- Transparency: You can always ask why Stephanie made a choice the reasoning is in the report.
- Comparability: Two runs on the same goal produce two reports; their deltas show improvement.
- Self-Improvement: Reports are what Stephanie re-ingests to critique herself. They are the feedback loop.
- Audit Trail: For research or production, reports provide a defensible chain of reasoning.
Example Workflow
    flowchart TD
    A[⚙️ Events] --> B[📋 Plan Trace + Steps]
    B --> C[📝 Report Formatter]
    C --> D[📑 Report Artifact]
    D --> E[🔍 Human Review]
    D --> F[🔄 Self-Improvement Loop]
-
Events → generated live during execution.
-
Plan Trace → ensures events are ordered and contextualized.
-
Report Formatter → transforms structure into narrative.
-
Report Artifact → final Markdown, saved in the DB & file system.
-
From there:
- Humans can review.
- Stephanie can score and learn from it.
⚡ The Report is the product of Stephanie’s cognition. Pipelines are execution, scores are feedback, but the report is where thought crystallizes into knowledge.
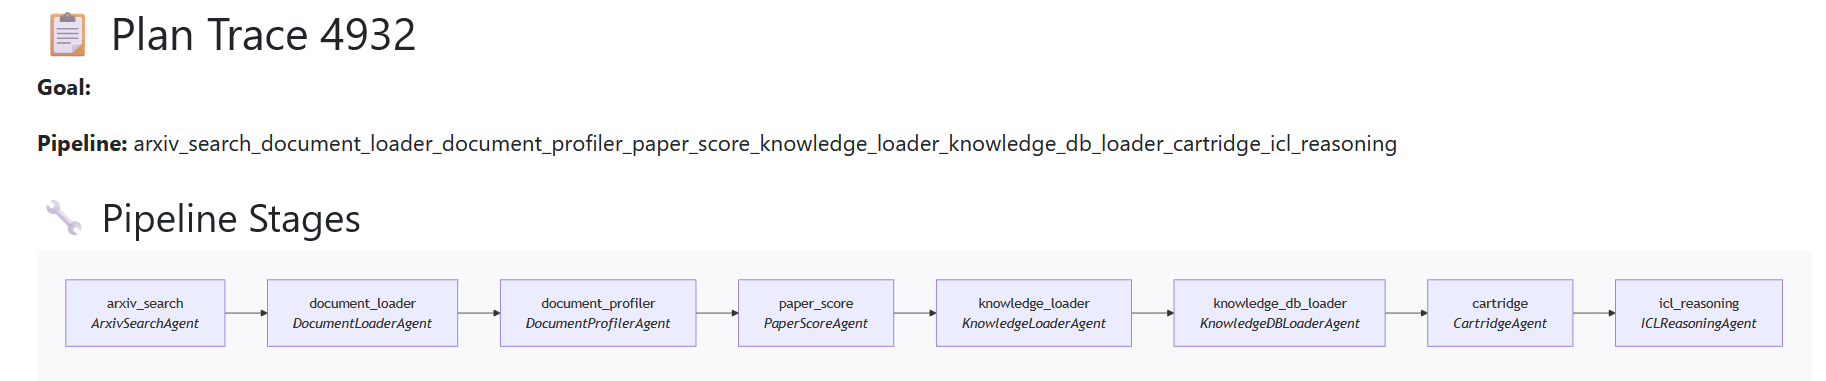
📋 Plan Traces
The Plan Trace is the complete, time-ordered record of a single pipeline execution. It captures the “how” of Stephanie’s problem-solving process, providing a granular audit trail of every step taken.
On this page, you can see the full sequence of stages that were executed, including:
- Execution Order: The precise sequence of agents (e.g.,
arxiv_search→document_loader→cartridge). - Timing Data: How long each stage took to run, from start to finish.
- Context Flow: A summary of the data (keys and sizes) that was passed into and out of each stage.
- Error Tracking: If a stage failed, the error message and traceback are recorded here.
This level of detail is fundamental to Stephanie’s potential for self-improvement. By analyzing Plan Traces, we can understand the internal dynamics of a pipeline—identifying bottlenecks, debugging failures, and ultimately, using this data to train the system to make better decisions in the future. It turns a single run into a valuable learning experience.
🧩 Models View
The Models View provides a structured way to inspect the models currently available to Stephanie. It’s essentially a filesystem browser for the models directory, but presented directly inside the SIS dashboard.
This is useful because Stephanie relies on many different model types (MRQ, SICQL, EBT, HRM, SVM, etc.), each stored in its own subfolder. The Models View lets you quickly check:
- ✅ Which models are installed and available
- ✅ Their directory hierarchy (by type, dimension, or domain)
- ✅ Whether new models have been trained and registered

Visual Verification
Models are the scoring and reasoning backbone of Stephanie. The ability to explore them interactively helps with:
- Debugging – confirm models are in the right place and loaded correctly.
- Transparency – see what Stephanie is actually using under the hood.
- Self-Improvement Loop – new models trained during runs appear here automatically, making progress visible.
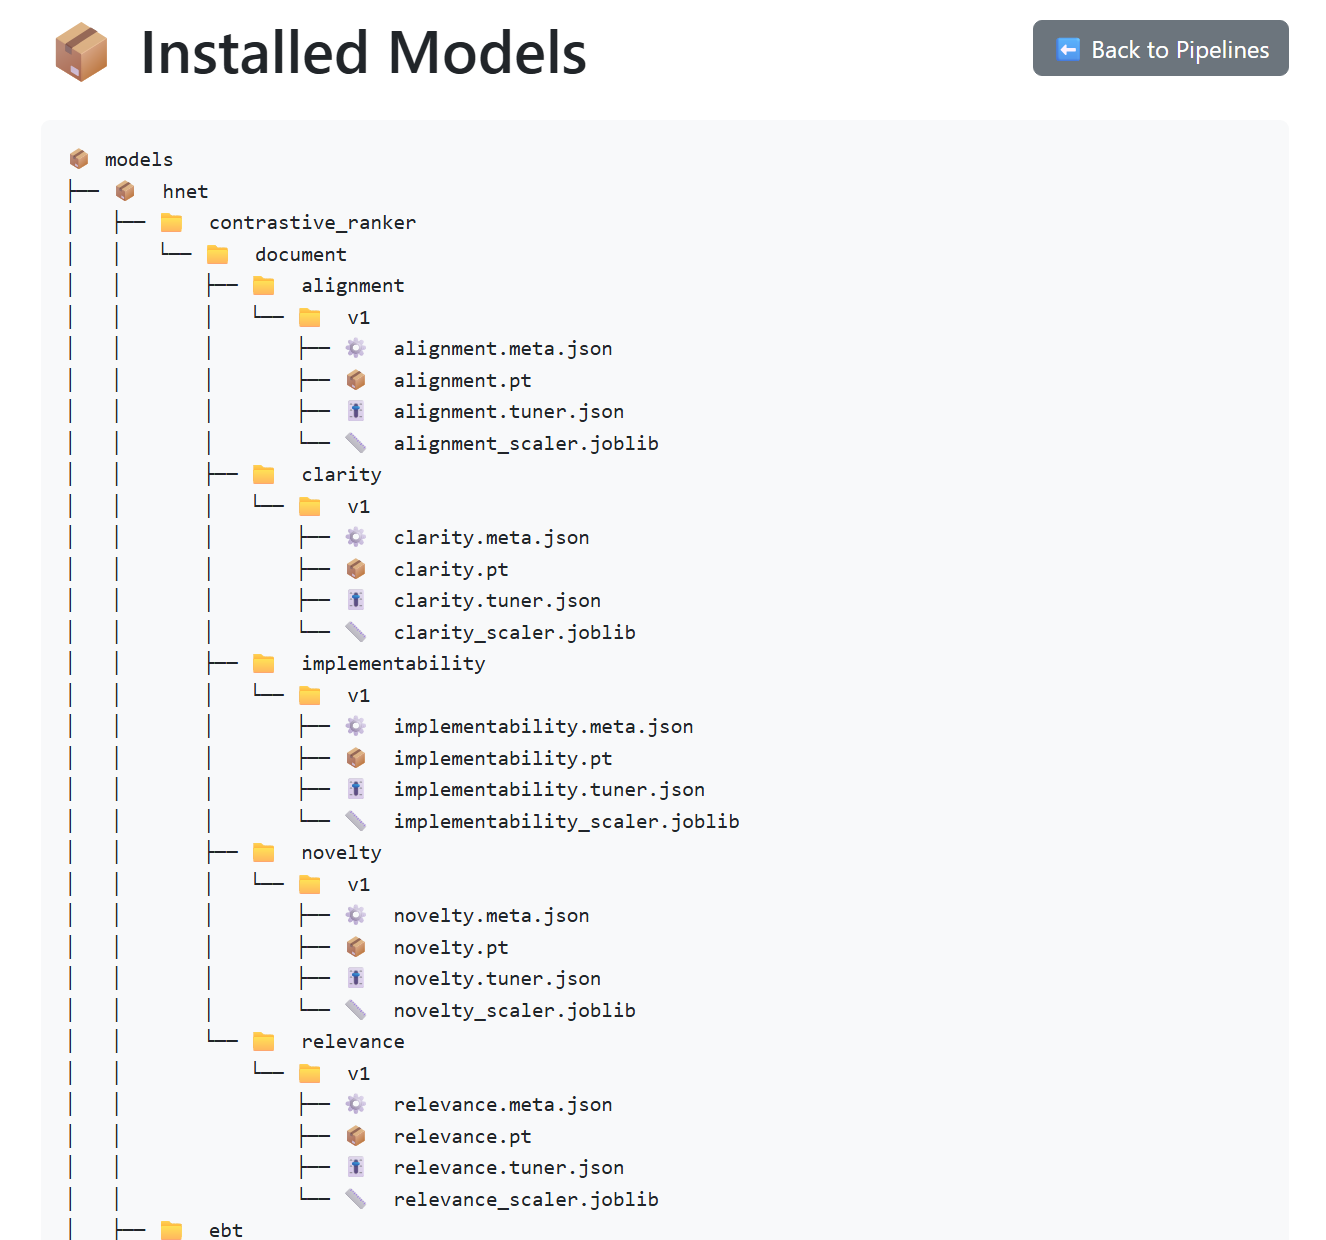 Figure: Models View in SIS, showing the structure of all models created inside Stephanie. Because Stephanie can dynamically generate models per embedding type (h-net, ollama huggingface) for each scorer (MRQ, SICQL, EBT, HRM, etc.), this view helps navigate what can quickly grow into hundreds of model files.
Database Router
For raw visibility into tables:
As Stephanie grows larger and accumulates more data, it becomes increasingly difficult to understand the true scale of the database and where that data is going. The database viewer is designed to make this clear by showing table sizes, row counts, and relative usage at a glance.
@router.get("/db-overview", response_class=HTMLResponse)
def db_overview(request: Request):
    tables = session.execute(text("""
        SELECT tablename FROM pg_catalog.pg_tables WHERE schemaname='public'
    """)).fetchall()
    ...
    return templates.TemplateResponse("db_overview.html", {"tables": table_data})
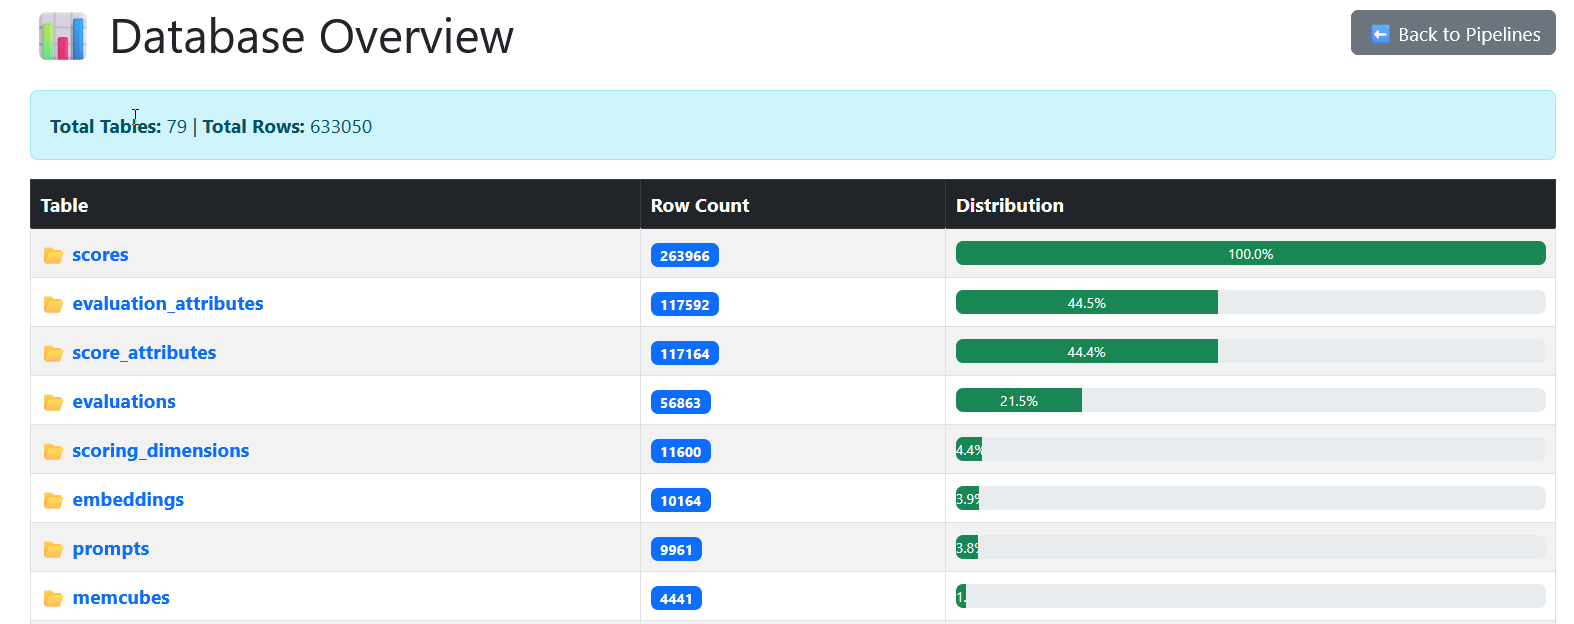
Figure: SIS Database view showing all tables, the number of rows in each, and a percentage-based bar chart for relative size.
🎓 Lessons Learned
-
Visibility drives improvement – By surfacing pipeline runs in SIS, we immediately spotted where information was being lost or where scores weren’t being applied correctly. Problems that were invisible in raw logs became obvious in the dashboard.
-
Reports moved from add-on to core – What began as a “nice to have” feature turned into a central artifact. Reports now feel just as important maybe even more important than plan traces, because they provide a clear path to the solution in a way humans can directly use.
-
Pipelines gain new meaning – Viewing them through SIS reframed the pipeline not just as execution, but as a feedback mechanism: a structured way for Stephanie to learn from its own results.
🩰 Next Steps
-
Live pipeline control in SIS – Move beyond viewing: SIS will soon be able to run pipelines, rerun specific stages, and act as a controller for Stephanie.
-
Zero-Model integration – The next blog post will introduce Zero Model into Stephanie, creating a visual AI that you can see, explore, and dynamically control inside SIS.
-
Refactored agents & pipelines – All agents will be updated to produce proper reports, and all pipelines will be refactored to fully support SIS. Older blog posts will be updated with attached reports so readers can see real outputs.
-
Unified reporting as a standard – Reports will become a first-class artifact across the system, not an add-on, making every pipeline run reproducible, comparable, and sharable.
-
Database flexibility – We’re removing the hard-coded Postgres dependency so Stephanie can run on SQLite or DocDB. This will make it possible to run locally (even in Colab) without extra setup.
⚒️ What SIS Adds to Stephanie
With this release, SIS turns Stephanie from a set of raw pipelines into a navigable source of knowledge. Here’s what SIS adds:
- 📊 Pipeline visibility – list runs, drill into details, and see every stage at a glance.
- 🧠 Plan Traces – interactive Mermaid diagrams of pipeline execution, making the process transparent.
- 📝 Reports as first-class outputs – structured, human-readable summaries that capture what the pipeline achieved.
- 📜 Logs & context – easy access to raw prompts, responses, and configs for deep debugging.
- 📚 Document browser – see which papers and sources fed into a pipeline.
- 📈 Scores & evaluations – compare outputs across MRQ, EBT, SICQL, HRM, and more.
- 📦 Cartridges & theorems – surface the reusable knowledge artifacts Stephanie generates.
- ⚙️ Config inspection – view the exact configuration used to produce a run, making experiments reproducible.
In short: SIS takes the hidden internals of Stephanie and turns them into something humans can see, understand, and improve.
🪞 Conclusion
Pipelines alone generate data lots of it. But without direction, knowledge risks becoming just documentation.
SIS changes that. It turns raw data into information, and information into artifacts that can actually be used plan traces, reports, scores, and cartridges.
With SIS, Stephanie’s outputs stop being fragments and start becoming knowledge we can learn from, build on, and improve.
SIS is the window through which Stephanie’s knowledge becomes visible, understandable, and improvable, transforming output into better information.
    flowchart LR
    A["⚙️ Pipelines<br/><i>raw execution</i>"]
    B["👀 SIS Feedback<br/><i>visualize & organize</i>"]
    C["🧩 Information<br/><i>traces, reports, scores, cartridges</i>"]
    D["🤖 Better AI<br/><i>tuning & improvement</i>"]

    A --> B --> C --> D --> A

    classDef exec fill:#2b6cb0,stroke:#fff,stroke-width:2px,color:#fff
    classDef feedback fill:#38a169,stroke:#fff,stroke-width:2px,color:#fff
    classDef info fill:#d69e2e,stroke:#fff,stroke-width:2px,color:#fff
    classDef ai fill:#805ad5,stroke:#fff,stroke-width:2px,color:#fff

    class A exec
    class B feedback
    class C info
    class D ai
📚 Glossary
| Term | Definition |
|---|---|
| Stephanie | The core AI system — a multi-agent framework designed for reasoning, learning, and self-improvement through structured pipelines. |
| SIS (Stephanie Insight System) | A web-based dashboard that provides visibility into Stephanie’s pipelines, reports, scores, and internal state. It acts as a GUI for observability and analysis. |
| Pipeline | A sequence of agent stages (e.g., arxiv_search, cartridge, icl_reasoning) that execute in order to achieve a goal. Each run is a single execution of a pipeline. |
| Plan Trace | A detailed, time-ordered log of a pipeline’s execution. It records each stage, its inputs, outputs, duration, and context — serving as the foundation for debugging and self-improvement. |
| Report | A human-readable Markdown document generated at the end of a pipeline. It summarizes the goal, process, key findings, scores, and final outputs like cartridges and theorems. |
| Cartridge | A structured unit of distilled knowledge extracted from documents or reasoning steps. Cartridges are reusable artifacts that Stephanie can reference in future tasks. |
| Theorem | A high-level insight or principle extracted from one or more cartridges. Theorems represent generalized knowledge that captures patterns or conclusions from the data. |
| Prompt | The input text sent to an LLM at each stage of a pipeline. Prompts are dynamically rendered with context and drive the agent’s reasoning process. |
| Evaluation | The process of scoring a candidate output (e.g., a prompt response or cartridge) across multiple dimensions like relevance, clarity, or novelty. |
| Score | A numerical value assigned during an evaluation, often broken down by dimension (e.g., clarity: 0.82). Multiple scorers (MRQ, EBT, HRM) may contribute. |
| Document | Raw knowledge sources (e.g., research papers from Arxiv) retrieved and processed during a pipeline. These form the basis for generating cartridges and theorems. |
| Configuration (Config) | The YAML file that defines how a pipeline runs — including agents, scorers, models, and settings. SIS displays a sanitized snapshot for reproducibility. |
| MemoryTool | Stephanie’s internal data access layer that handles database operations. SIS reuses this tool to query and display pipeline data from PostgreSQL. |
| Embedding | A vector representation of text (e.g., a document or prompt) used for similarity search and retrieval. SIS supports backends like HNet and pgvector. |
| Self-Improvement Loop | The feedback cycle where Stephanie uses reports, scores, and plan traces to refine its agents, prompts, and strategies over time — aiming to get better with each run. |
📚 Further Reading & References
| Resource | Description |
|---|---|
| LangChain Observability | A practical guide to monitoring and debugging LLM applications. While Stephanie is custom-built, LangChain’s approach to tracing, logging, and evaluation offers valuable parallels for anyone building multi-agent systems. |
| Weights & Biases (W&B) for ML Ops | A leading platform for experiment tracking, model evaluation, and visualization. SIS shares W&B’s philosophy of making AI workflows transparent and reproducible, albeit focused on pipeline-level reasoning rather than model hyperparameter tuning. |
| Retrieval-Augmented Generation (RAG) Papers | The foundational paper on RAG by Lewis et al. Stephanie’s use of documents, embeddings, and cartridges builds upon RAG principles, extending them into a self-reflective, pipeline-based knowledge synthesis system. |
| Mermaid.js Documentation | The library powering SIS’s interactive flowcharts. Mermaid is a lightweight, text-based tool for generating diagrams from code, making it ideal for visualizing dynamic pipeline executions without complex frontend tooling. |
| FastAPI Documentation | The modern Python framework that powers SIS’s backend. FastAPI’s speed, automatic API docs, and async support make it a perfect fit for building responsive, developer-friendly AI dashboards. |