Benchmarking Against Established Engines
A matched comparison of the capstone and library decode loops: first-token latency, throughput, memory, token agreement and extraction success, with explicit limits on comparisons that could not run.
The heavy workload supplies the chapter’s first warning against declaring a performance winner from one latency column. In the recorded five-trial comparison, the capstone with batched decode reached a median first-token time of 0.071 seconds; the local library loop using static batches of four reached 0.879 seconds. Their median output throughputs were nearly identical, at 56.05 and 55.28 tokens per second. Yet their median shares meeting both service thresholds were 0.63 and 0.96, respectively. Getting the first token out sooner did not ensure that the rest arrived quickly enough. A repeated run under an identically configured capstone name reached a median SLO share of 0.91, an early warning that the apparent gap needs independent confirmation.
The separate extraction task makes the distinction between performance and usefulness sharper. At eight running requests the batched capstone completed 60 order descriptions in a median 30.1 seconds; its serial configuration took 127.3 seconds. Both recovered the correct order after removing surrounding output for only 17 of 60 inputs, and only 5 of 60 responses were exact as written. In these runs, increased execution speed did not repair incorrect fields or turn a wrapped JSON fragment into a compliant as-written answer.
These are book results from one shared RTX 2060, one pinned model and a frozen local workload. The comparison is among the capstone and two local Transformers-based loops, not vLLM, SGLang, DeepInfer or a hosted provider. Those external-engine comparisons remain NOT_RUN. The chapter reports the measurements that exist, keeps quality and SLO outcomes next to speed, and refuses to turn an empty comparison cell into a ranking.
The question
Adding Multiple Model Backends showed what happens when one backend capability changes: a batched decode call replaces separate forward passes. This chapter asks a broader question. Given the same request tokens, arrivals, output policy and model, how do complete serving configurations compare on first-token delay, later-token cadence, completed work, memory use and generated answers? That is a systems comparison, not a single-kernel microbenchmark.
An inference system is a bundle of choices: admission, queuing, batching, cache representation, precision, stopping, and event timing. When two bundles differ, an observed performance difference belongs initially to those complete configurations. It is tempting to name the scheduler or attention implementation as the cause. That requires a controlled ablation, not just two endpoint rows. The more decisive question is what service users receive under a declared acceptance rule, and how much of any advantage survives variation.
The capstone’s comparison boundary uses the open-loop load generator from Latency, Throughput and Time to First Token, the reproducibility distinctions from Correctness, Determinism and Reproducibility, and the paired-trial methodology of Designing Meaningful Inference Benchmarks. It then adds a task-level test from Structured Outputs and Constrained Decoding. The final chapter, What We Learned: Inference From First Principles, must judge these findings together with their limits, especially the unexecuted external-engine and client-side comparisons.
Decide what is being compared
Before measuring, identify the unit of comparison. An engine experiment fixes a model and asks how different software paths serve it. A service experiment asks which complete offering produces acceptable results for a task, potentially with different models, tokenizers and prices. Those experiments can share a workload description, but they answer different questions and cannot share a performance league table without qualification.
For a same-model engine experiment, freeze the weights and revision, tokenizer revision, actual input token ids, stop and output-length policies, sampling parameters, prompts and arrival schedule. State the precision, attention implementation, CPU/GPU placement, batching, admission and cache policies for every configuration. If the question is software efficiency, hold hardware fixed. Equal requested output lengths do not imply equal work when servers stop early, emit auxiliary reasoning tokens, tokenize differently or buffer results. Store the raw generated token ids so that agreement and denominators can be audited rather than inferred from final text.
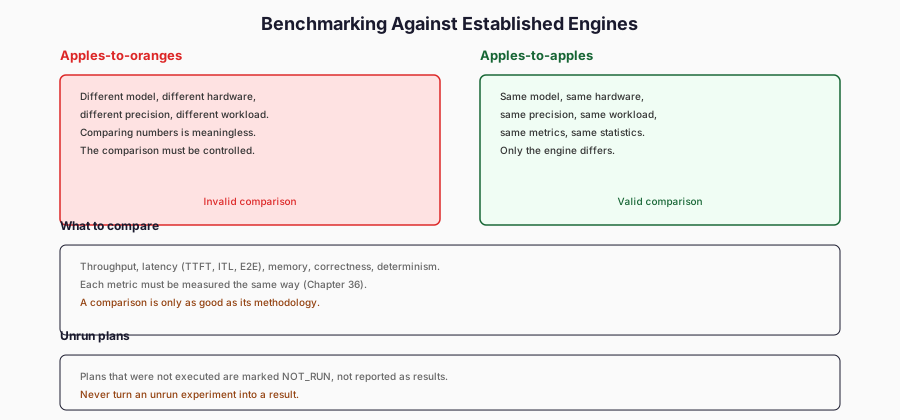
For a task-level service comparison, define the scorer and the policy for extracting an answer before viewing outputs. Charge the complete path, including retries, formatting, errors and unserved requests, to the service being evaluated. Hosted APIs do not ordinarily expose the provider’s kernels, cache management or fully pinned hardware. They belong in a separate task-service study unless equivalent model and measurement controls can actually be established. No hosted-provider calls were made for this chapter.
The distinction has a research precedent. Reddi and colleagues’ MLPerf Inference Benchmark (ISCA 2020) motivates representative scenarios, reproducible measurements and comparable quality requirements across diverse inference systems. Today’s MLPerf Inference: Datacenter documentation distinguishes Closed comparisons, which retain the reference model, from Open submissions that can change the model. The present suite borrows the discipline of declaring a scenario and an acceptance test. It is an educational benchmark, not an MLPerf run, submission or certification; its metrics and rules must be described independently.
What actually ran
Six configurations were executed in the frozen open-loop suite. The names below are exact record identifiers, and should be retained when reproducing a table or querying raw runs. The last is a deliberate A/A copy: it uses the same capstone settings as cap-batched-8 so that measurement variability can be observed rather than hidden.
| Configuration | Admission and decode |
|---|---|
hf-b1 |
Latency, Throughput and Time to First Token’s library-based serving loop, static batch size one |
hf-b4 |
The same loop, static batch size four |
cap-queue-1 |
Capstone scheduler with one running request and per-sequence decode |
cap-sched-8 |
Capstone scheduler with up to eight running requests and per-sequence decode |
cap-batched-8 |
Capstone scheduler with up to eight running requests and one batched decode call |
cap-batched-8-copy |
The previous configuration under another name, for an A/A comparison |
The hf labels mean local serving code built with the Transformers model, not the hosted Hugging Face Inference service. In this suite they also do not mean model.generate: the batch-one and batch-four rows use Latency, Throughput and Time to First Token’s explicit static-batch decode loop. The later order-extraction task does use the library’s generate, with its own batching and stopping path. Treating these distinct baselines as interchangeable would make the comparison irreproducible.
Every open-loop suite configuration uses the same Qwen3-0.6B weights and tokenizer, both at revision c1899de289a04d12100db370d81485cdf75e47ca, with float16 and SDPA attention. The saved environment records Windows 11, Python 3.13.15, PyTorch 2.6.0+cu124, Transformers 5.17.0, NumPy 2.5.3, CUDA runtime 12.4 and driver 591.44, on an RTX 2060 12 GB shared with desktop activity. The GPU process was pinned to logical CPUs 0–15 of an i9-12900KF. These are provenance details, not a claim that CPU pinning made the desktop machine perfectly isolated.
Both model and software revisions are part of the treatment record. Loading a newer artifact under the same model name is a new experiment; so is moving from this PyTorch/Transformers stack to a newer one with different kernels. A valid reproduction should capture the original run commands, the model/tokenizer checksums or immutable revisions, device state, and the exact code revision at measurement time. The present result builder hashes the files available during the editorial audit; those hashes cannot recover a measurement-time commit that the raw records did not store.
The suite constructs its engine adapters around a model already loaded in the process. Consequently, the reported GPU peaks are additional CUDA allocation over the stated loaded-model baseline during a run, not standalone process residency, total device memory, or the capacity a fresh deployment must reserve. Different engines can also reserve pools or use separate processes. Those startup and allocator-policy differences must be measured on a common basis before any hardware-capacity or deployment-cost ranking is justified.
Freeze requests before comparing clocks
The suite uses Designing Meaningful Inference Benchmarks’s manifest with recorded hash 3b0c7161424a16e2. Each of its three workloads has five trial seeds. Within a trial, every configuration receives the same generated token inputs, requested output lengths and arrival offsets; configuration order is randomised and recorded. This is paired at the workload-trial level, not a claim that individual queued requests are independent experimental replicates.
| Workload | Measured requests, plus warm-up | Arrival rate | Requested output |
|---|---|---|---|
| Light | 24, plus 4 | 0.5 requests/s | 16–48 tokens |
| Heavy | 54, plus 6 | 1.8 requests/s | 16–48 tokens |
| Long | 30, plus 4 | 0.7 requests/s | 48–96 tokens |
Arrivals are open loop: request offers follow their declared schedule whether earlier requests have completed or not. That avoids the self-throttling of a closed-loop client, but it also means an overloaded configuration can accumulate a queue. Offered arrival rate, achieved throughput and successful completion count must not be conflated. The light, heavy and long cases are intentionally different traffic regimes, not a representative sample of all traffic or an empirical capacity curve.
For the performance suite, generation is made to continue for the prescribed number of output steps by suppressing the selected end-token stopping behaviour. This improves computational comparability but does not mirror ordinary user-visible stopping and should not be interpreted as a completed-answer or quality test. The separate order-extraction experiment below restores the relevant generation and answer-scoring behaviour; its timings are therefore not directly interchangeable with open-loop suite throughputs.
The saved suite has 90 run records: 3 workloads × 5 trials × 6 configurations. research/ch44/results.json on the capstone work branch reports one environment, one workload hash per workload, matching request digests inside each paired block, and no recorded run errors. Those checks establish a necessary input-comparability boundary. They do not prove identical code paths, queue policies, output semantics or experimental conditions outside the recorded manifest. A publishable next run should enforce these checks as gates before computing ratios and preserve all unsuccessful runs.
Cache state can invalidate an apparently matched comparison. Repeated prompts, retained blocks and warmed prefix indexes alter the amount of work performed; different engines have different default reuse and reset rules. The vLLM Benchmark CLI documentation describes client-side serving measurements and mechanisms for repeatable benchmark invocations, but does not constitute evidence that this book executed vLLM. Here the results do not establish a controlled cross-engine prefix-cache comparison. A future replay must record cache policy, warm-up, resets, hits and whether two requests actually share a prefix.
Define the measurement point
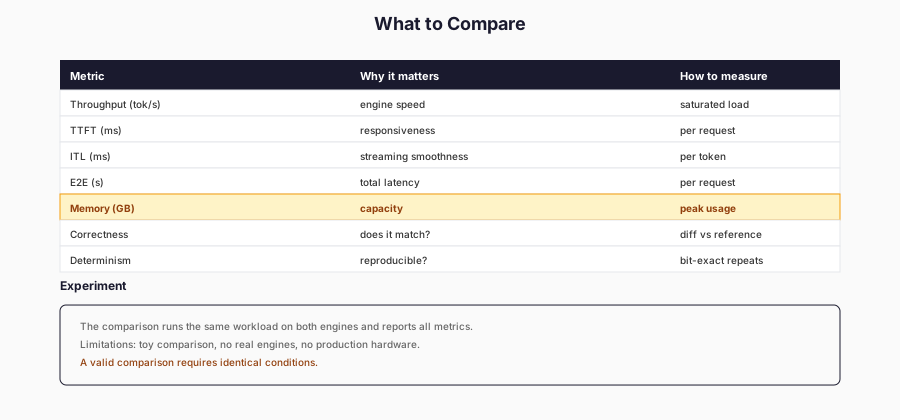
Let $s$ denote the timestamp assigned at submission, $f$ the recorded first-token time, $l$ the recorded last-token time, and $n$ the number of emitted output tokens. At that in-process timestamp boundary, the reported basic metrics are:
The clocks here are taken inside one process. The capstone’s load-generator adapter timestamps TokenEvents and marks a job done when its declared final token is recorded. That is not a browser or remote client observing bytes on a socket, and it may precede later terminal handling. A client-side benchmark includes scheduling, network transport, serialization, streaming buffers and client parsing. Even when both are labelled TTFT, comparing the two without stating their capture points would misattribute part of the difference to the inference engine.
The vLLM online benchmark documentation defines client-observed streaming metrics, including first-token time and token gaps; their observation boundary differs from this lab’s in-process event clock. The branch contains HTTP replay and measurement code, but the frozen Chapter 44 result has http_check.status = NOT_RUN: no corresponding HTTP measurement artifact is included. Thus no client-visible latency, server-to-client overhead or real-network scalability conclusion follows from these numbers.
Output throughput divides generated output tokens by the measured run window. It is not the sum of individual request token rates, the offered request rate or the count of correctly extracted answers. The suite’s request-level acceptance rule combines TTFT no greater than 2 seconds with TPOT no greater than 60 milliseconds; both must pass. This is a service-level share measured over served requests, not a hard guarantee, and it can deteriorate even while aggregate output tokens per second remain unchanged. A full deployment gate would also account for rejected, timed-out and failed requests.
Results: a scheduler changes the shape of waiting
The following values are medians of five per-trial summaries from research/ch44/results.json, rather than pooled medians across every request. Peak memory is additional allocated GPU memory, in decimal MB, above the experiment’s baseline. cap-batched-8-copy is omitted from this main table because it is an A/A control, but its result is material to the interpretation below. No line should be read as independent evidence of what vLLM, SGLang or DeepInfer could achieve.
| Heavy workload | TTFT, s | End-to-end, s | Output tokens/s | Peak MB | Share meeting service level |
|---|---|---|---|---|---|
hf-b1 |
20.054 | 20.863 | 25.45 | 125 | 0.00 |
hf-b4 |
0.879 | 2.028 | 55.28 | 467 | 0.96 |
cap-queue-1 |
21.519 | 22.709 | 24.94 | 58 | 0.00 |
cap-sched-8 |
18.037 | 27.396 | 24.03 | 203 | 0.00 |
cap-batched-8 |
0.071 | 1.812 | 56.05 | 404 | 0.63 |
The heavy workload demonstrates why having several requests in flight and executing several sequence rows together are different interventions. cap-sched-8 interleaves eight requests but still makes per-sequence decode calls. Its median first-token delay improves only modestly relative to a serial capstone, and its median end-to-end time becomes worse under queue pressure. This repeats the lesson of Implementing Scheduling and Caching in an open-loop workload: redistributing waiting is not the same as increasing computational throughput.
cap-batched-8 executes a batched forward pass and achieves throughput close to the library’s static batch-four loop: 56.05 versus 55.28 output tokens/s at their displayed medians. It advances the first token dramatically, but the subsequent-token cadence is less favourable, so the combined median SLO shares are 0.63 and 0.96. Neither a shorter TTFT nor a nearly equal tokens/s rate makes this a universal win. The comparison mixes scheduling and batch implementation choices, and its SLO verdict is particularly sensitive to the A/A spread discussed below.
The light workload supplies only about 0.5 requests per second. Its output throughput medians—13.28 tokens/s for hf-b1, 12.87 for hf-b4, and 13.17 for cap-batched-8—mainly reflect the offered work, not the engines’ saturation limits. If arrivals seldom keep the GPU busy, near-equal achieved throughput says very little about maximum capacity. This regime is nevertheless informative about batch-formation delay, empty-queue overhead and other latency effects at low utilisation.
On the long workload, median TTFT is 0.058 seconds for cap-batched-8 against 1.237 for hf-b4, while median E2E is 3.008 versus 3.594 seconds and median throughput 49.35 versus 48.93 tokens/s. The fast first token does not imply a comparable multiplier in total completion time, because prefill, decoding and queuing contribute differently. It is essential to inspect TPOT and the combined SLO as well as TTFT before claiming a user-experience advantage.
Variation is part of the result
The table compares cap-batched-8 with hf-b4 within each matched trial. Designing Meaningful Inference Benchmarks’s method averages the logarithms of positive within-trial ratios and exponentiates them: the result is a geometric mean of paired ratios with a nominal 95% t-interval on log ratios. It is not obtained by dividing the medians displayed above. All interval statements are conditional on five workload-level repetitions and the statistical assumptions of this analysis.
| Metric | Light | Heavy | Long |
|---|---|---|---|
| Median TTFT ratio | 0.40 (0.12–1.31) | 0.086 (0.069–0.106) | 0.045 (0.030–0.069) |
| Output throughput ratio | 1.031 (0.995–1.069) | 1.018 (0.989–1.048) | 1.017 (0.981–1.055) |
| Share meeting service level, ratio | 1.09 (0.87–1.37) | 0.64 (0.44–0.94) | 1.39 (1.12–1.73) |
Under the displayed paired-log intervals, no throughput ratio differs detectably from one. Heavy and long TTFT ratios favour the capstone. The heavy combined-SLO ratio, however, favours hf-b4, while the long SLO ratio favours the capstone. These are metric-specific, exploratory interval findings, not a declaration that either full serving system is best. With five trials, an exact two-sided sign-flip test has a smallest possible p-value of 0.0625, even if all five effects have the same sign; that additional diagnostic does not give a conventional 5% rejection in these cases. The distinction between a parametric confidence interval and an exact small-sample test belongs in the interpretation.
A trial, not a request, is the unit of independent replication assumed here. All requests in a trial share the queue, arrival process, model and hardware conditions, so treating their token observations as separate repeats would overstate precision. The intervals also assume that variation across five trials is adequately represented by the paired-trial model; they do not cover other machines, code revisions, model families, workloads or a multiple-comparison correction. A next experiment should specify one primary SLO or quality endpoint, a practically meaningful effect size, and an independent holdout before collecting more trials.
The A/A control is unusually revealing. cap-batched-8 and cap-batched-8-copy have the same recorded settings, but on heavy traffic their displayed median SLO pass shares are 0.63 versus 0.91; across five trials the first ranged from 0.35 to 0.87 and the second from 0.44 to 1.00. The paired t-interval for their average SLO-share difference includes zero. Yet on the light and long workloads, the A/A TPOT difference intervals exclude zero in the t-analysis, even though the exact five-pair sign-flip p-value is 0.0625. Thus it would be false to claim that every A/A metric is statistically indistinguishable. The appropriate conclusion is that trial/order variation and small-sample method choice are material, particularly near the 60 ms TPOT threshold; an A/A cell is not evidence of equivalence merely because its headline interval contains the null.
Ratio statistics require a positive denominator. Some serial configurations meet the heavy combined SLO for zero requests. Dividing another system’s pass share by zero does not produce an infinite meaningful speedup; the analysis records undefined pairs and returns no geometric ratio when too few valid pairs remain. Report the absolute SLO pass shares and paired percentage-point differences instead. For any SLO share, zero and one are genuine boundary values, not measurements to be silently replaced by a small constant just to obtain a finite logarithm.
Agreement is a separate gate
Relative to hf-b1, the capstone’s serial and per-sequence versions produced identical output token sequences on every measured request. The batched capstone’s mean within-trial identity shares were 0.992 on light, 0.981 on heavy, and 0.953 on long traffic; hf-b4 scored 0.992, 0.989, and 0.953 on those same workloads. These are identity relative to the batch-one reference, not accuracy against a ground-truth answer. The denominator is all measured requests in each workload, aggregated over five trials; a request that differs by one token fails strict identity just as one that diverges completely does.
Shape-dependent floating-point computations provide a plausible explanation for those token changes, consistent with Correctness, Determinism and Reproducibility, but this experiment did not trace each divergence to a particular kernel or logit tie. A different token can have identical task meaning, or it can alter every subsequent word. It is therefore wrong to infer either semantic equivalence or a quality loss from the identity percentage alone. For a deployment that needs reproducibility, the reference must include batch shape, software stack and seed policy; for a deployment that needs reliable answers, the acceptance criterion must be evaluated on the answers themselves.
A quality gate must be defined before performance optimisation and enforced rather than merely printed beside a throughput score. Under a strict identity gate, batched configurations that differ on any request cannot claim exact parity for those runs. Under a task-quality gate, one must run a validated scorer with an explicit tolerance or error budget and compare successes on paired inputs. The present benchmark reports identity but does not use it to veto its exploratory performance intervals. Designing Meaningful Inference Benchmarks’s proposed enforcement work remains relevant here: a fast-but-invalid output cannot be promoted by a favourable latency cell.
Results: delivering an answer is not solving the task
The separate task uses Structured Outputs and Constrained Decoding’s synthetic order-description generator and evaluator: 60 items created with seed 44, greedy decoding, a 160-token output cap and three timing repetitions of the same 60 inputs for each system. Unlike the frozen step-count benchmark, this task uses model-generation stopping and evaluates final text. The evaluator distinguishes exact, schema-compliant output as written from the answer after extract_json removes surrounding material, and then checks extracted field values against each item’s gold record. That post-processing operation is part of the declared acceptance policy, not free improvement in the model.
| System | Median seconds, range | Peak additional MB | Exact as written | Exact after cutting |
|---|---|---|---|---|
Library generate, batch one |
127.7 (122.9–142.9) | 38 | 5/60 | 17/60 |
| Capstone serial | 127.3 (123.4–129.6) | 38 | 5/60 | 17/60 |
| Capstone per-sequence, eight running | 132.6 (128.6–141.3) | 224 | 5/60 | 17/60 |
| Capstone batched, eight running | 30.1 (29.9–33.4) | 466 | 5/60 | 17/60 |
| Capstone batched, sixteen running | 23.1 (22.3–24.1) | 932 | 5/60 | 17/60 |
Library generate, batch eight |
16.5 (16.1–17.3) | 255 | 5/60 | 18/60 |
The library’s batched model.generate is faster than the capstone’s batched path on these 60 items: 16.5 seconds at batch eight versus 30.1 seconds for the capstone at eight running, and 23.1 seconds for the capstone at sixteen. The capstone uses an explicit, inspectable scheduling path and a stack-and-split cache implementation; the library uses its own generation loop. These are whole-path measurements, not a controlled decomposition proving how many seconds came from cache copies, Python dispatch, different batch shapes or the library’s generation internals. They also describe a fixed task set, not throughput under an online arrival rate.
Every system produced outputs for all 60 items, and extract_json yielded 60 schema-valid objects for each; nevertheless, only 17 of 60 were field-correct for five configurations, with 18 of 60 for library batch eight. Only 5 of 60 outputs were exact as written for every configuration. The library batch-eight run changed the text for one of 60 items relative to library batch one and gained one correct extraction. That isolated difference is not evidence that batching improves reasoning or field extraction. The strict-as-written and post-processed scores are different service contracts and must never be merged into one “accuracy” figure.
Each configuration generated the same text across its three repetitions, so those repetitions provide three elapsed-time observations but not 180 independent quality examples. Treating the 60 synthetic items as independent draws from the stated generator, the Wilson 95% interval for 17/60 is approximately 0.185–0.408. This interval is not an uncertainty statement about real-world order extraction, nor does it account for correlations induced by one generator or prompt style. A realistic quality qualification needs held-out natural inputs, adversarial ambiguity, independently checked labels and an explicit rule for cases where no field value is known.
The two experiments answer complementary questions. The matched load suite tests how promptly a fixed amount of decoding work is served; the extraction task tests whether a generated answer satisfies a stated task contract. The capstone can preserve most token outputs and reduce elapsed time without making the 17 incorrect-or-correct decisions any more accurate. Conversely, the fastest task configuration can emit one different and more accurate answer without proving a model-quality gain. Chapter 44’s conclusion is thus a vector of measured outcomes, not a ranked winner.
Rebuild the comparison
The implementation isolates the comparison in three modules. examples/ch44/engines.py wraps SerialEngine/BatchEngine behind Latency, Throughput and Time to First Token’s load-generator job interface and records emitted token times. compare_lab.py defines the six system configurations, enforces the existing workload manifest, executes the open-loop suite and order-extraction task, and contains separate plans for prospective HTTP or external-engine runs. compare_analysis.py computes paired-trial summaries, memory, token agreement and scorer outcomes; research/ch44/build_results.py rebuilds their evidence register. The current branch also includes focused tests of this plumbing. These names identify a locally built experiment, not a new universal benchmark standard.
To inspect the existing artefacts without executing the model again:
python research/ch44/build_results.py
python -m pytest tests/test_ch44_comparison.py tests/test_ch44_comparison_lab.py -q
For a genuine new run, keep the original raw files read-only and choose fresh paths: the suite command appends records to its output file. Reusing the previous output path could silently create duplicate workload–trial–configuration cells and invalidate pairing. Capture the git commit, working-tree state, model/tokenizer revisions, exact command and software manifest before measurement; archive both successful and failed request records. Match one complete block of six configurations per workload/trial and reject incomplete or duplicated blocks rather than selecting whichever result looks favourable.
python examples/ch44/compare_lab.py suite --out research/ch44/raw/new-suite.jsonl --trials 5 --seed 44
python examples/ch44/compare_lab.py task --out research/ch44/measurements/new-task.json --items 60 --reps 3 --seed 44 --max-new 160
The commands above reproduce or extend the experimental workflow; they were not executed as part of this manuscript edit. The result builder calculates SHA-256 hashes of the available raw run file, task evidence and selected code files. Those are meaningful snapshot-integrity checks but have a known limit: the measurement-time git revision was not recorded. Hashing today’s source does not prove it is identical to the code that produced the measurements. Future runs must record the code identity at execution time and keep the original artifacts immutable so that this distinction disappears.
Book hypothesis for the next independent run: Holding the model, quality acceptance, workload, and output policy fixed, batched decode will increase offered-load capacity over per-sequence decode; relative to another batched engine, the outcome will depend on arrival patterns and cache design. Pre-register a primary endpoint (for example SLO-qualified goodput), a minimum worthwhile difference, a strict or task-level output-quality gate, and a memory budget. Measure more than five independent trials, include a new-seed A/A control, and preserve a held-out workload untouched by tuning. A quality failure, an SLO-goodput deficit, a memory-budget breach or no practically meaningful gain would defeat the corresponding prediction. This is a proposed test, not an accomplished finding.
The comparison we still owe
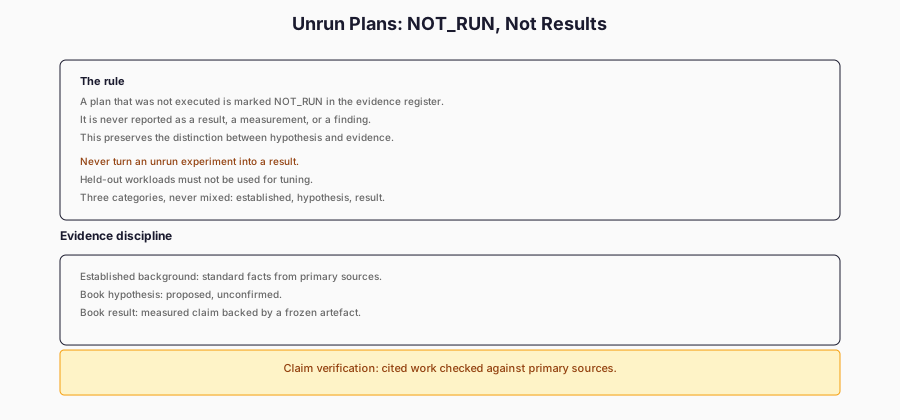
The earlier Adding Multiple Model Backends environment probe found vllm 0.30.0 installed but unable to import because vllm._C_stable_libtorch was missing, and found SGLang not installed. Chapter 44 does not repeat those probes. DeepInfer was also NOT_RUN, and hosted APIs were excluded by design because they could not meet the same-model comparison contract. It would be inaccurate to infer that any of those engines is incompatible in general, slower, faster or unlicensed from these observations. An unavailable local installation is evidence about that installation at that moment, not about the project’s architecture or performance.
A legitimate external-engine study begins with a verified runnable installation and pinned revision, then confirms that the chosen engine can accept equivalent inputs and decoding/stopping rules. Replay the same token-id inputs and arrival schedule where the public interface permits it; if it does not, record the tokenization or API boundary difference and classify the run separately. Collect client-side TTFT, token cadence, completion, errors, startup residency, incremental and peak GPU memory, and output identity or task scores. Archive exact invocation flags and environment details, including failures. Without these controls, a row of a public benchmark or a launch suggestion is a useful reference but not an experimental peer to the capstone.
The repository’s replay and execution-plan modules provide a starting point for that follow-up, not result rows. Their NOT_RUN fields remain empty until a qualified run supplies raw requests, outputs and hardware measurements. Likewise, an upstream paper’s author-reported throughput on another GPU, model, arrival process or latency target is a literature result, never a substitute for a local measurement. If no established external engine can be run here, publish the engineering blocker and the exact conditions for retrying instead of filling the gap with an estimate.
Inference Lab increment
The Chapter 44 increment is a comparison boundary around the Inference Lab runtime: a common workload manifest, per-run identifiers, record validation, a paired-trial analysis, an A/A arm, token-identity checks and a task scorer. It preserves the important identities of the capstone scheduler, the HFBackend/BatchedHFBackend adapters and the separate Transformers library loops. Those are inspectable engineering results in their own right. They do not imply a general-purpose performance ranking until quality, timing and resource criteria have been satisfied on a sufficiently varied set of workloads.
The remaining evidence gaps should travel with any published graph: one small pretrained model; one desktop-shared RTX 2060; five open-loop trials per cell; short contexts and outputs; no network latency; no independently rerun vLLM, SGLang or DeepInfer; no startup-memory or power/cost accounting; and a synthetic extraction corpus with weak field-level correctness. The A/A heavy-SLO spread is substantial, and measurement-time code provenance is missing. These are not reasons to discard the chapter’s results. They specify where its conclusions stop and what What We Learned: Inference From First Principles may legitimately carry forward.
What you should now be able to do
- Define whether the estimand is same-model engine efficiency or task-level service quality, and refuse to merge the two silently.
- Audit matching token inputs, output policy, arrival process, environment and workload-trial identifiers before computing a paired comparison.
- Interpret TTFT, TPOT, last-token completion, output-token throughput, SLO pass share and incremental GPU memory as different outcomes of the same run.
- Read a paired geometric ratio beside its five-trial interval, exact small-sample diagnostic and identically configured A/A control.
- Distinguish token identity, schema compliance as written, compliance after extraction and correctness of extracted fields.
- Explain why three timing repetitions of the same 60 orders are not 180 independent quality examples.
- Publish a missing engine comparison as NOT_RUN, with the actual blocker and a reproducible plan for collecting valid evidence.
Key terms
- Matched workload: identical declared token inputs, offered arrivals, output policy and scoring boundary across configurations.
- Engine comparison / service comparison: respectively, the same pinned model under different execution systems, or whole offerings evaluated against a task acceptance criterion.
- Paired trial: corresponding workload-trial runs; the trial, not each queued request, is the unit used for the interval here.
- A/A comparison: two differently labelled executions of one configuration, exposing order effects and measurement variability without a designed system change.
- TTFT / TPOT: time to the first output token and average time between later output tokens, each at an explicitly stated observation boundary.
- SLO-qualified goodput: useful completions per unit time that satisfy a declared latency and quality requirement; not directly calculated as the chapter’s ordinary output-token throughput.
- Quality gate: a pre-specified, enforceable acceptance condition for what is produced, not merely a metric printed next to speed.
- Additional allocation: peak allocated GPU memory during a run above the defined loaded-model baseline, not whole-process residency.
- NOT_RUN: no qualifying experiment record is available; an installation probe or a paper’s reported value does not change that.
Reader exercises
- Recalculate the heavy
hf-b4andcap-batched-8rows from their raw per-trial summaries. Show why the ratio of displayed medians is not the paired geometric mean, and list the exact trial pairs used. - Examine
cap-batched-8andcap-batched-8-copyon heavy traffic. Explain how the same configuration can have median SLO shares of 0.63 and 0.91, and why neither a wide paired interval nor a single A/A run proves equivalence. - Compute the smallest possible two-sided exact sign-flip p-value with five nonzero pairs. Contrast it with the chapter’s parametric confidence intervals and design a longer independent trial plan.
- Recompute extraction accuracy twice, once demanding valid and exact JSON as written, and again permitting
extract_json. Show which requests change status and justify the product contract you would use. - Investigate one token mismatch between a batched system and
hf-b1: store first-divergence positions and compare next-token logits under matching and changed batch shapes. Do not assume a floating-point near-tie without evidence. - Produce an external-engine run on a compatible machine only after documenting the pinned model, input-token equivalence, command, client-side timestamps, failures and full memory baseline. Otherwise publish the
NOT_RUNblocker unchanged. - Replace the capstone’s cache-copying batched adapter with persistent state, and evaluate the change on separate development and held-out traffic with a strict task-quality gate.
- Extend the benchmark with SLO-qualified goodput and error/rejection accounting. Does the configuration favoured by TTFT still win when the denominator counts only acceptable answers?
References and evidence
The following distinguish primary research, live implementation documentation, and book-generated evidence. No cited paper’s reported system throughput is presented as reproduced locally.
- Research — MLPerf Inference Benchmark — Reddi et al., ISCA 2020. Establishes the methodological motivation for comparable scenarios, performance records and quality criteria across inference systems; the book is not an MLPerf submission.
- Research — DistServe: Disaggregating Prefill and Decoding for Goodput-optimized Large Language Model Serving — Zhong et al., OSDI 2024. Connects TTFT and TPOT requirements to SLO-qualified serving capacity. Its authors’ results concern a different serving architecture and are not replicated here.
- Research — The Tail at Scale — Dean and Barroso, Communications of the ACM, 2013. Provides the wider systems rationale for measuring tail behaviour and variability rather than optimising an average alone; not an inference-engine benchmark run in this book.
- Documentation — vLLM Benchmark CLI — living project documentation; consulted for client-observed latency definitions and reproducibility considerations, not evidence that vLLM ran.
- Documentation — MLPerf Inference: Datacenter — official overview of scenarios, model/quality requirements and Open versus Closed division; not a certification of this suite.
- Local evidence —
research/ch44/results.jsonand its raw inputs (research/ch44/raw/results.jsonl,research/ch44/measurements/task_cuda_float16.json) on the comparison work branch. The builder records SHA-256 hashes and explicitly discloses the missing original measurement-time code revision. - Earlier local evidence —
research/ch43/results.jsonfor dated vLLM/SGLang availability observations; those probes were not rerun for Chapter 44.
Implementation status
Manuscript and evidence: content/books/inference/44-chapter.md interprets the frozen local comparison and extraction experiment; research/ch44/results.json contains the rebuilt results and input hashes on the capstone work branch. Implementation: examples/ch44/engines.py, compare_lab.py, compare_analysis.py, replay/plan utilities, focused tests and the result builder provide the local experiment and an unexecuted route toward external comparisons. Qualification: the saved suite has 90 run records and task measurements, but the originally measured code revision is missing; independent technical review and publication approval are outstanding. Client-side HTTP benchmarking and vLLM, SGLang, DeepInfer and provider engine comparisons are NOT_RUN/EXCLUDED as stated, not hidden passes. Nothing here establishes production readiness or an established-engine ranking.
Continue to What We Learned: Inference From First Principles.